Tag Archives: earnings-center

Real Estate Mutual Funds To Buy On Sector Reversal

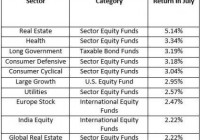
Recent construction spending data was disappointing, but the Real Estate sector has a lot to cheer for. The decline may be a blip for the Real Estate sector, which scored the best gains in July among all categories of funds. The Real Estate sector’s July gains reversed the negative three-month return. The robust performance in July is also a massive improvement from the second quarter’s loss of 7.7%. The Global Real Estate sector lost 4.4% in the second quarter. Among the top five, strong gains were scored mostly by Sector Equity funds. According to Morningstar data, four of the five best category gainers in July were Sector Equity funds, while Long Government from Taxable Bond Funds category was the other one. Markets began the second half of 2015 on a positive note as all benchmarks ended July in the green. The Dow, S&P 500 and Nasdaq rose 0.4%, 2% and 2.9% in July. Markets managed to register gains in July despite weak earnings and international growth concerns. China’s equity markets underwent a significant downturn, heightening investor concerns. Meanwhile, oil prices remained southbound, leading to losses for the sector. Real Estate Gains Over 5% in July Source: Morningstar The Real Estate sector’s over 5% gain in July outpaced the second-place Health sector, which otherwise has been a consistent top performer. Global Real Estate sector also featured in the top 10 gainers’ list. The Consumer sector has been enjoying a multitude of positives including improving economic numbers. The Europe Stock sector’s inclusion was not much of a surprise after Greece’s debt negotiations concerns ebbed. Also, data from the Investment Company Institute revealed that U.S.-based mutual funds had poured $5.1 billion to international stock funds for week ending July 22. This inflow was largely boosted by optimism that European shares will outperform the US counterparts. Coming back to the best gainer – Real Estate, along with resurgence in the labor market, homebuilding has been one of the bright spots of the economic recovery. In July, Case-Shiller data showed that home price growth had declined marginally, which indicated that the recovery is stabilizing. As homebuilders cater to tight housing supply, the demand for building materials is expected to remain high. Given such a scenario, investing in producers of such goods remains a prudent move. July Data Indicated Strength Housing data released in July indicated a healthy pace of growth. Building permits jumped 7.4% from May, while privately-owned housing starts surged 9.8% in June. Existing home sales increased 3.2% to a seasonally adjusted annual rate of 5.49 million in June, beating the consensus estimate of 5.4 million. Sales increased at the fastest rate since Feb 2007. Homebuilder sentiment was also upbeat. Homebuilders’ confidence for new single-family homes, as indicated by the National Association of Home Builders (NAHB)/Wells Fargo housing market index (HMI), remained at 60 in July – the highest reading since Nov 2005. The June reading was revised upward to 60 from 59 earlier. The only jarring note was struck by a surprising decline in new home sales. This metric declined to its lowest level in seven months in June. At the end of July, the National Association of Realtors reported that Pending Home Sales Index, a forward-looking indicator based on contract signings, went down 1.8% to 110.3 in June. The consensus estimate had projected a rise by 1.5%. Home Price Rise Moderates S&P/Case-Shiller Home Price Indices data indicates that home prices are continuing to rise. However, the extent of price increases seems to have moderated. In May, the U.S. National Home Price Index increased 4.4% on an annual basis, higher than the 4.3% rise experienced in April. The 10-City Composite increased 4.7% on an annual basis in May, higher than the 4.6% recorded in April. However, the rate of gain for the 20-City Composite declined. This index increased 4.9% on a year-over-year basis in May, a shade lower than the increase recorded in April. More importantly, post seasonal adjustment the national index remained flat on a month-over-month basis. However, both the 10-City and 20-City Composite Indexes declined 0.2% on a monthly basis. This marginal decline shows that the housing price increases are stabilizing. It actually bodes well for the sector, since it could lead to sustainable growth for the housing sector. Moderating prices imply that the demand-supply situation is stabilizing to a point where affordability increases for buyers. Large increases in prices have kept several potential buyers away from the housing market. This could now cease being a concern. Top 10 Real Estate Fund Gainers Below we present the top 10 gainers from the Real Estate sector in July: Note: The list excludes the same funds with different classes, and institutional funds have been excluded. Funds having minimum initial investment above $5000 have been excluded. The best gain was scored by PIMCO Real Estate Real Return Strategy A (MUTF: PETAX ), which currently carries a Zacks Mutual Fund Rank #1 (Strong Buy). Also carrying favorable ranks are Virtus Real Estate Securities A (MUTF: PHRAX ), Fidelity Real Estate Investment (MUTF: FRESX ), Principal Real Estate Sec A (MUTF: PRRAX ) and AMG Managers Real Estate Securities (MUTF: MRESX ). All these funds carry a Zacks Mutual Fund Rank #2 (Buy). However, not all funds are safe picks at the moment from this list. While Oppenheimer Real Estate A (MUTF: OREAX ) carries a Zacks Mutual Fund Rank #5 (Strong Sell), Ivy Real Estate Securities A (MUTF: IRSAX ) and Voya Real Estate A (MUTF: CLARX ) hold a Zacks Mutual Fund Rank #4 (Sell). For investors interested in the Real Estate sector, below we present 2 funds that are most likely to continue uptrend. They carry favorable Zacks Mutual Fund Rank, have low expense ratio and carry no sales load. The minimum initial investment is within $5000. Fidelity International Real Estate (MUTF: FIREX ) invests a large chunk of its assets in companies related to real estate sector. FIREX focuses on acquiring common stocks of companies located in foreign countries. FIREX diversifies its assets across a wide range of countries. FIREX currently carries a Zacks Mutual Fund Rank #1 and has returned 5.4% year to date. The 3- and 5-year annualized returns are 13.7% and 10.4%. The annual expense ratio of 1.13% is lower than the category average of 1.40%. CGM Realty (MUTF: CGMRX ) seeks high income and long-term capital appreciation. CGMRX invests a lion’s share of its assets in securities of real estate companies including REITs. CGMRX may invest a maximum of 20% of its assets in securities that are not related to real estate domain, which also include debt securities. CGMRX invests in companies located throughout the globe irrespective of their market capitalizations. CGMRX currently carries a Zacks Mutual Fund Rank #1 and has returned 4.7% year to date. The 3- and 5-year annualized returns are 11.8% and 12.6%. The annual expense ratio of 0.92% is lower than the category average of 1.33%. Original Post

A Pleasant Surprise Among Emerging Market ETFs

Broadly speaking, these are not the best of times for emerging market exchange traded funds. India large-cap ETFs have been significantly better or less bad than other single-country and diversified emerging markets ETFs over the past month. In the near term, India ETFs could pullback following the Reserve Bank of India’s decision Tuesday to hold interest rates at 7.25 percent. By Todd Shriber, ETF Professor Broadly speaking, these are not the best of times for emerging market exchange traded funds. Things are so bad that 22 emerging markets funds hit 52-week lows on Monday. Since the star of the current quarter, the iShares MSCI Emerging Markets ETF (NYSEARCA: EEM ) has bled nearly $2.5 billion in assets. However, there is some light among the darkness and it comes courtesy of Indian small-caps. India large-cap ETFs have been significantly better or less bad than other single-country and diversified emerging markets ETFs over the past month, but funds such as the Market Vectors India Small-Cap Index ETF (NYSEARCA: SCIF ) , the EGShares India Small Cap ETF (NYSEARCA: SCIN ) and the iShares MSCI India Small Cap Index ETF (BATS: SMIN ) have legitimately impressed . While the MSCI Emerging Markets Index has tumbled 5.6 percent over the past month, the aforementioned trio of India small-cap ETFs posted an average return of almost 5.5 percent. This is not unfamiliar territory for India ETFs, which were the shining stars of the BRIC quartet last when emerging markets equities slumped. In the near term, India ETFs could pullback following the Reserve Bank of India’s decision Tuesday to hold interest rates at 7.25 percent, but the central bank has obliged with three rate cuts earlier this year, at least two of which can be considered surprises. Interestingly, the gains for Indian small-caps over the past month arrived as investors pulled $35 million from Indian stocks last month, still a scant percentage of the $7.1. billion that has flowed into stocks in Asia’s third-largest economy this year, according to Bloomberg . Divergent Returns Significant differences between the India small-cap ETFs tell the story of divergent returns. For example, the Market Vectors India Small-Cap Index ETF features a 21.2 percent to consumer discretionary stocks, leveraging the ETF to India’s burgeoning consumer story. SMIN, the iShares offering, is also a play on India’s resurgent domestic economy with a 44.3 percent allocation to financial services and industrial names. The EGShares India Small Cap ETF devotes over half its weight to financial stocks and industrials. A BlackRock fund manager recently sounded a bullish tone on Indian non-bank financials and select sub-sectors of the industrial space. Though the fund manager did not mention the ETFs highlighted here, institutional support for Indian small-caps should drive the likes of SCIF, SCIN and SMIN higher. Indian small-caps are not a bump-free ride. For example, SCIF has a three-year standard deviation of almost 32 percent, or 2 1/2 times that of the MSCI Emerging Markets Index. However, Indian small-cap, at least as measured by SCIF and SCIN, are not excessively valued. SCIF sports a price-to-earnings ratio of just 11 , while SCIN’s price-to-book ratio is just 1.16. Disclaimer: Neither Benzinga nor its staff recommend that you buy, sell, or hold any security. We do not offer investment advice, personalized or otherwise. Benzinga recommends that you conduct your own due diligence and consult a certified financial professional for personalized advice about your financial situation. Disclosure: I/we have no positions in any stocks mentioned, and no plans to initiate any positions within the next 72 hours. (More…) I wrote this article myself, and it expresses my own opinions. I am not receiving compensation for it. I have no business relationship with any company whose stock is mentioned in this article.

Buying The Dip In Apple? You’re A Market Timer

The last time Apple pulled back 10%-plus from its peak and fell below its 200-day trendline, the stock went on to lose 33% from that moment forward. In a market where the median U.S. stock sports its highest P/E and P/S ratios ever, Apple is a relative “bargain.” However, I am not particularly interested in writing about the merits of Apple as a buying opportunity. I am far more intrigued by discussing the hypocrisy of the buy-n-hold community. One of the media’s biggest financial stories this week involves the curious fall of Apple (NASDAQ: AAPL ). Specifically, the largest company in the world by market capitalization has entered correction territory – a 10%-plus fall from a high-water mark. Not surprisingly, few analysts have soured on shares of the culture changer. Even fewer are discussing the technical resistance near $133 per share let alone the drop below a 200-day moving average. The last time Apple pulled back 10%-plus from its peak and fell below its 200-day trendline, the stock went on to lose 33% from that moment forward. Obviously, history rarely repeats itself in identical fashion. What’s more, in a market where the median U.S. stock sports its highest P/E and P/S ratios ever, Apple is a relative “bargain.” Heck, Apple even offers an attractive dividend that you wouldn’t be able to count on from most companies in the white hot biotech space. On the other hand, I am not particularly interested in writing about the merits of Apple as a buying opportunity. On the contrary. I am far more intrigued by discussing the hypocrisy of the buy-n-hold community. In particular, “don’t try to time the market” pretenders are the first in line to discuss the benefits of buying Apple as it trades at a 10% price discount from its highs. If you’re a buyer of stock at a particular time at a specific price, you are timing the market. If you rebalance when you perceive your allocation is out of whack, you are a market timer as well. You are selling some assets at one price and buying other assets at another price. There’s also the hold-n-hope claim that one sticks to his/her asset allocation mix through thin and thick. If that is so, then where does the 60%-40% stock-bond asset allocator suddenly have more cash to buy more Apple shares? Retirees with rollovers sure wouldn’t have it from work income. Even for the buy-n-hold asset allocator who claims he would use the income from dividends and interest or “work” to buy more Apple is being disingenuous. If you have no intention of timing the market, all of the monies would be reinvested immediately; you would not be waiting for an opportunity. The whole idea of a buying opportunity is, by definition, a market timing endeavor. And yet, people only scream bloody murder about market timing when someone suggests selling assets . It does not matter if you adhere to fundamental rules (e.g., extreme overvaluation versus undervaluation) and technical trends (e.g., deteriorating breadth/market internals versus improving breadth/market internals). When the stock market is on a six-year bull run, anything that resembles risk reduction is regularly panned. My tactical asset allocation strategy for reducing exposure to riskier assets involves reducing (not eliminating) exposure to riskier assets when valuations are hitting extremes, technical internals are deteriorating and economic indicators are weakening. When valuations are fair, internals are improving and economic signs are strengthening, we raise exposure to riskier assets back to a client’s target mix. Market timing? Sure, in the same way that opportunistic rebalancing activity and opportunistic efforts to buy quality stocks like Apple at lower prices fit the bill. Indeed, the staunchest advocates of buying-n-holding, including the wonderfully talented Warren Buffett, have a plan for when and what to buy and when and what to sell. Mr. Buffett’s decision to sell all of his Exxon Mobil (NYSE: XOM ) shares in the wintertime demonstrated that there are opportunities to reduce perceived risks, just as others may view the acquisition of more Apple shares today as sensible risk. Just be honest, Mr. Buy-the-Apple-Dip Advocate. Your attempt to acquire shares of Apple at a 10% price discount today is an effort to time the market for when to acquire more of the stock. And more power to you! However, let’s imagine that I dared to opine that overall risks in the stock market are exorbitantly high. And that I put forward a notion that if Apple represented 15% of a portfolio, perhaps one might wish to reduce the exposure to 7.5%. (Remember, I am asking one to imagine this proposition.) Immediately, there would be calls for my “market timing” head. The mere suggestion of selling or rebalancing based on fundamental, economic and technical analysis would be deemed blasphemous. Not surprisingly, the loudest screams about the evils of market timing come during the height of bull market euphoria. Ironically, near the lowest ebb of bear market distress – whether it is with individual shares of Apple (10/2012-7/2013) or with broad market benchmarks like the S&P 500 (e.g., 2000-2002, 2007-2009, etc.), those screams turn to whimpers. The facts that I have been presenting for several months still remain. The U.S. economy has been showing signs of strain, regularly missing expectations and estimates. Corporate revenue has now declined year-over-year for two consecutive quarters, pushing valuations on stocks to higher extremes. Meanwhile, market breadth has shown no signs of recovering since May, when the S&P 500 Bullish Percentage Index straddled 75% (today closer to 50%) and the NYSE Advance Decline (A/D) Line hit its last peak. Disclosure: Gary Gordon, MS, CFP is the president of Pacific Park Financial, Inc., a Registered Investment Adviser with the SEC. Gary Gordon, Pacific Park Financial, Inc, and/or its clients may hold positions in the ETFs, mutual funds, and/or any investment asset mentioned above. The commentary does not constitute individualized investment advice. The opinions offered herein are not personalized recommendations to buy, sell or hold securities. At times, issuers of exchange-traded products compensate Pacific Park Financial, Inc. or its subsidiaries for advertising at the ETF Expert web site. ETF Expert content is created independently of any advertising relationships.