Tag Archives: earnings-center
Don’t Overpay For An Epic Investing ‘Fail’
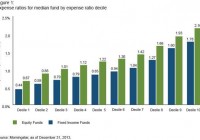
Summary Lowering the cost of actively managed funds is an important step in improving the odds of outperformance. Highly rated funds are not good predictors of future performance. Why a holistic approach with good judgment, including quantitative and qualitative elements is a “WIN!” By Chris Philips, CFA An investing “FAIL”? Pop culture and investing rarely cross paths. After all, pop culture is hip, exciting, and flashy. Conversely, we’ve seen that successful investing is generally anything but. Nevertheless, the last decade or so has seen the rise of an internet meme that may be applicable to the investing world-“FAIL.” So what are a “FAIL” and its illustrious cousin “epic FAIL”? Both are generally used to describe embarrassing events, such as setting your kitchen on fire as you film yourself attempting to light birthday candles (FAIL)-by using a blowtorch to be cool (epic FAIL). Now I hope none of us have burned down a house while reviewing an investment portfolio! So I can’t visualize an investing epic FAIL in this vein (although some may suggest that the global financial crisis would suffice), but there are at least three areas where I can confidently say FAIL: cost, ratings, and performance. The cost-value riddle First up is the issue of cost. People intuitively associate higher cost with value and performance. Unfortunately, it’s backwards. For example, see Figure 1, where I break out U.S. equity and fixed income funds into deciles according to their reported expense ratios. Cost and performance ARE related. However, the data show that the lower the cost, the better the experience (on average). You should pay more for performance? FAIL (click to enlarge) Relying on ratings Next is the question of industry ratings. The allure of something-anything-that could potentially help us do better by our clients is strong. Figure 2 illustrates this -investors have clearly favored higher-rated funds and shunned lower-rated funds. These patterns wouldn’t be noteworthy if 4- and 5-star-rated funds consistently added value. (Or perhaps they would be, if they revealed a metric that could reliably predict performance!) However, in the research underlying Figure 2, we showed that highly rated funds in one rating period tended to be the worst performers relative to a style benchmark over the next 3 years-underperforming on average by 138 basis points per year. Funds with 1-star ratings also underperformed, but at a much more modest rate of 15 basis points per year. You should stick to top-rated funds? FAIL Patience and performance Of course, some may dismiss the cash-flow example as “retail” investors chasing returns. However, there’s also evidence of return-chasing among institutional investors.[1] After all, we are all human, whether acting in a fiduciary capacity or on our own behalf. In an article published in The Journal of Finance , Amit Goyal and Sunil Wahal reported on the outcomes of hire/fire decisions across a broad sample of plan sponsors. They found that underperforming managers were (not surprisingly) replaced with managers who demonstrated significant outperformance (represented with blue bars in Figure 3). I say “not surprisingly,” because what fiduciary would want to keep an underperforming fund or asset on the books? However the twist is in what happened following the replacement. On average, those managers who were hired to replace the poor performers underperformed the same managers they replaced in the next 1-, 2-, and 3-year periods! In Figure 3, this record is shown by the green bars. You should systematically replace underperformers? FAIL Avoiding FAIL The moral of this story is that while ratings and cost should not be summarily dismissed, we should take a collective step back and think about what really matters when constructing portfolios or looking to provide clients with the best opportunity for success. Controlling costs is critical, to be sure. But equally important is a robust evaluation process that includes many variables for considering whether fund A, B, or C should be added, dropped, or ignored. Such a qualitative process can complement the quantitative metrics that have been shown to potentially lead us astray. A holistic approach with good judgment, including quantitative and qualitative elements? Now that’s a WIN! Footnotes Mark Grinblatt, Sheridan Titman, and Russ Wermers initiated the academic literature on return-chasing behavior among institutional investors in their paper “Momentum investment strategies, portfolio performance, and herding: A study of mutual fund behavior,” The American Economic Review , 85(5), 1995. Notes All investing is subject to risk, including the possible loss of the money you invest. Past performance does not guarantee future results.
Expensive Junk Stocks Are Killing High-Quality Value Stocks, YTD
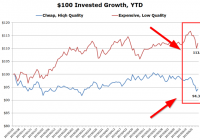
By Wesley R. Gray, Ph.D. In general, investors focused on affordable stocks with strong fundamentals have been taken to the cleaners year-to-date. Meanwhile, expensive stocks with poor fundamentals have been rocking ! Some Basic Statistics: Below, we document some core performance figures using Ken French’s data on value/growth portfolios (proxy for cheap/expensive) and high-profitability/low-profitability portfolios (proxy for high-quality/low-quality). We look at the value-weight returns for the top and bottom decile portfolios. The monthly returns runs from 1/1/2015 to 6/30/2015. Results are gross of fees. All returns are total returns, and include the reinvestment of distributions (e.g., dividends). Specifically, here are the four portfolios: Expensive = Value-weight returns to the bottom decile formed on B/M. Cheap = Value-weight returns to the top decile formed on B/M. Low-Quality = Value-weight returns to the bottom decile formed on profitability. High-Quality = Value-weight returns to the top decile formed on profitability. Here are the month-by-month results – a nasty year for cheap value stocks (as proxied by B/M) and high-quality stocks (as proxied by profitability): Month Expensive Cheap Outcome Low-Quality High-Quality Outcome 201501 0.04% -6.87% Lose -1.68% -2.17% Lose 201502 6.71% 3.56% Lose 9.64% 6.55% Lose 201503 -0.69% -1.59% Lose -0.31% -0.66% Lose 201504 0.19% 1.81% Win -0.53% 0.80% Win 201505 2.17% 0.58% Lose 5.18% 0.78% Lose 201506 0.61% -0.71% Lose -1.38% -1.24% Win The results are hypothetical, and are NOT an indicator of future results, and do NOT represent returns that any investor actually attained. Indexes are unmanaged, do not reflect management or trading fees, and one cannot invest directly in an index. Additional information regarding the construction of these results is available upon request. How have Expensive Low-Quality Stocks Performed Relative to Cheap High-Quality Stocks? In this section we look at the YTD performance of expensive low-quality stocks versus cheap high-quality stocks. We examine value-weight returns for the cheap high-quality quintile and the expensive low-quality quintile. The daily returns run from 1/1/2015 to 6/30/2015. Results are gross of fees. All returns are total returns, and include the reinvestment of distributions (e.g., dividends). Specifically, here are the two portfolios: Cheap, High-Quality = Value-weight returns to the cheap high-quality quintile . Expensive, Low-Quality = Value-weight returns to the expensive low-quality quintile . (click to enlarge) The results are hypothetical, and are NOT an indicator of future results, and do NOT represent returns that any investor actually attained. Indexes are unmanaged, do not reflect management or trading fees, and one cannot invest directly in an index. Additional information regarding the construction of these results is available upon request. Year-to-date, a portfolio of cheap high-quality socks is down around 6% , before fees and expenses (probably more like -7% if those were included). In contrast, a portfolio of the most expensive, lowest-quality firms is up around 12% , before fees and expenses (probably around 11% after fees). On net, the spread is almost 18% YTD. Incredible, but not unsurprising . When we look to the marketplace for live strategies focused on market-neutral strategies anchored on cheapness and quality, Gotham Funds’ Gotham Neutral Fund (MUTF: GONIX ) is probably the most prominent example. The fund isn’t completely market-neutral, but at a 25% net long exposure, that is about as close as we’re gonna get. YTD, the Gotham Neutral Fund is down 10.39%. That is pretty terrible, and it would have been worse if they were truly market-neutral, but in the context of the results above, where one goes long generic value/quality and short generic expensive/junk, -10%+ isn’t half bad . One could argue on a factor basis that they added value (I know, that sounds odd). As we’ve said time and time again, active value investing has been digging manager graveyards since 1900 … but that is the nature of the active value investing game… long horizons are required, and volatility relative to the standard benchmarks can be expected. Original Post