Tag Archives: earnings-center

Oil ETFs Gain On Lower U.S. Output Outlook

Fund holdings, ETF investing “}); $$(‘#article_top_info .info_content div’)[0].insert({bottom: $(‘mover’)}); } $(‘article_top_info’).addClassName(test_version); } SeekingAlpha.Initializer.onDOMLoad(function(){ setEvents();}); When it comes to economic growth, oil has been playing foul over the past one year. After terrible trading in the second half of 2014 and early 2015, oil has brought some respite and has been stuck in a tight range of $57-62 per barrel in recent weeks. While the drop in the U.S. oil rig count for the 26th straight week and billions of dollars in spending cuts are pushing the prices higher, the global oil glut has been the major headwind. However, this concern seems to be fading given the U.S. Energy Information Administration (EIA) report, which showed that the U.S. shale boom, the major source of global supply glut, is shrinking. The EIA expects oil production from the seven shale regions – Bakken, Eagle Ford, Haynesville, Marcellus, Niobrara, Permian and Utica – to fall by 1.3% to 5.58 million barrels a day in June and further by 1.6% to 5.49 million barrels a day in July. Additionally, total U.S. output will likely decline in the second half of the year through early 2016, as per the monthly report from the agency. Now, the agency sees U.S. oil production as averaging 9.4 million barrels per day for this year and 9.3 million barrels per day for the next, compared with 8.71 million barrels per day last year. On the other hand, the EIA also raised the global oil demand outlook to 93.3 million barrels per day for this year from 93.28 million barrels per day projected last month. Demand for 2016 is expected to see a jump to 94.64 million barrels per day. Given the new positive reports on demand/supply trends, both crude and Brent climbed over 3% on Tuesday, leading to impressive gains in the oil ETF world as well. The iPath S&P GSCI Crude Oil Total Return Index ETN (NYSEARCA: OIL ) was the biggest gainer on the day, rising about 3%, followed by gains of 2.75% for the United States Brent Oil ETF (NYSEARCA: BNO ), 2.54% for the United States Oil ETF (NYSEARCA: USO ) and 2% for the PowerShares DB Oil ETF (NYSEARCA: DBO ). These ETFs give investors direct access to dealings in the futures market (see: all the energy ETFs here ). The data from the American Petroleum Institute also led to the rally in oil prices and ETFs. As per the data, U.S. crude inventories fell by 6.7 million barrels in the week ended June 5 – the first weekly decline in three weeks. In today’s morning trading session, oil prices are also up more than 2% ahead of the inventory data, which suggests smooth trading by the ETFs in the coming days. The government data is expected to show that U.S. crude inventories fell at a faster pace by 1.7 billion barrels last week. Original Post Share this article with a colleague

SCANA Corporation: A Value Play On The Utility Sector Pullback

Summary The Utilities Select SPDR Fund has seen a double digit pullback from 52-week highs. SCANA Corp. has seen even greater losses, with a share price now down over 20% from January highs. This hefty pullback has brought SCANA back into fair value, and provides a nice entry point for long term investors. Background On January 21st, I wrote an article discussing the high valuations being seen among the utilities: ” Have We Reach The Point Of Irrational Exuberance In The Utility Sector? ” It turns out this article was published just one week before the 52-week high was made in the Utilities Select SPDR ETF (NYSEARCA: XLU ). Since then the sector has been in sell-off mode, as interest rates have started to rise and continued fears of a Federal Reserve rate hike looms. One of the utilities hit the hardest during the pullback has been SCANA Corporation (NYSE: SCG ), whose shares are down over 20% since the article was published. This divergence can be seen quite clearly in the chart below. 10 Year Treasury Rate data by YCharts SCANA has seen a 50% greater correction than the rest of the sector, and as a result is now trading below fair value for the first time since the end of September, 2014. (click to enlarge) For those not familiar with F.A.S.T. Graphs , the chart above shows the share price in relation to the PE trendline over the last five years. With the recent pullback, you can see where the share price has retreated to below the long term blue 14.3 PE trendline, which represents the average PE during the period. This is the first time SCANA has traded at that level since the end of September. Company Operations & Guidance SCANA Corporation is an energy-based holding company that is headquartered in Cayce, South Carolina. SCANA was formed in 1984 and currently serves over half a million electric customers in South Carolina and more than 1.2 million natural gas customers in South Carolina, North Carolina and Georgia. These service territories can be seen below, as depicted on page 9 of the company’s March presentation . (click to enlarge) SCANA has a diversified mix of power generation capabilities with assets in coal, natural gas, nuclear and renewables. Coal currently comprises roughly 50% of the mix, but that will be decreasing in the future as the company is in the process of adding two more units to its V.C. Summer nuclear plant, which will shift nuclear to 56% of dispatch power when they are completed. (click to enlarge) This has resulted in a high amount of CAPEX due to construction costs of the new nuclear facilities. These expenditures are expected to peak in 2016 and then continue downward until the new units are commissioned in 2019 and 2020. (click to enlarge) These expenditures have continually been adjusted upwards as the project progresses and this may be an item of concern in the future if there are further delays and cost overruns. However, thus far the company has maintained its stable BBB+ credit rating and appears to have these future costs accounted for with debt offerings and expected rate increases to consumers. Company Performance SCANA has been an excellent performer throughout the years, as it is a Dividend Contender from David Fish’s CCC List , and owns a 15 year streak of increasing dividends. During this period, the company has been able to grow earnings and dividends at a steady rate, with a long term EPS growth rate of 3.9% and a dividend growth rate of 4.4%. (click to enlarge) This consistent performance has led to outsized returns when compared to the market. With reinvestment of dividends, SCANA has produced annualized returns of 8.4% over the period, which crushed the S&P mark of 5.3%, and led to twice the total returns over the period. (click to enlarge) Another highlight to note is that investors who bought at the end of 2000 did so with an initial yield of 4.0%; and through the compounding power of reinvestment and dividend increases achieved a yield on cost over 10% after 10 years. Those investors would now be receiving 12.3% of their initial investment in annual dividends. Shares are yielding 4.3% with the recent pullback, and as things currently stand, investors have a good chance of seeing a similar situation play out over the coming decade. The company is currently projected earnings growth of 3-6% over the next few years. Analysts agree, and project the high end of this range was they expect 4-6% growth over the next 5 years. Using the mid-point of guidance, here are the income projections over the next 10 years with the reinvestment of dividends. Going back to F.A.S.T. Graphs and using the handy forecaster tool with a more aggressive estimated earnings growth of 6%, new investors could hope for annualized returns of nearly 12%. (click to enlarge) 12% annualized returns may not sound like much compared with what we’ve seen in recent years in the market, but it’s still well above historical returns, and doesn’t take any outlandish predictions for it to work out. Even dropping the growth rate down to the low end of guidance would lead to annualized returns of nearly 9%, which is a nice risk/reward type of investment. Investment Risks While SCANA is certainly becoming attractive at current prices, the pullback in the sector may not be over. Treasury yields have been on a steady rise since the beginning of the year, and as long as they continue rising there could be continued weakness in the utility sector. Additionally, the company does have some risk of its own with construction costs associated with the expansion of their nuclear power plant. Any further delays would lead to higher costs, and could lead to lower dividend and earnings growth rates than what is currently forecast. Conclusion SCANA Corp. appears to be an attractive income play in the current market environment. The company looks to be financially sound with a BBB+ credit rating and provides an appealing 4.3% yield that is expected to grow at a 3-6% annualized rate going forward. With shares currently below historical valuation levels, total return investors could also be looking at high single digit annualized returns. There could still be some downward pressure on shares if interest rates continue to rise, but the relatively high dividend yield pays you to wait for the rebound. Personally, I am looking to add another utility or two to my portfolio , and am strongly considering SCANA, along with several others on my watch list. I am currently looking for possible sales to free up capital for a purchase, and may be initiating a position within the next week or two. Disclosure: The author has no positions in any stocks mentioned, but may initiate a long position in SCG over the next 72 hours. (More…) The author wrote this article themselves, and it expresses their own opinions. The author is not receiving compensation for it (other than from Seeking Alpha). The author has no business relationship with any company whose stock is mentioned in this article. Additional disclosure: I am a Civil Engineer by trade and am not a professional investment adviser or financial analyst. This article is not an endorsement for the stocks mentioned. Please perform your own due diligence before you decide to trade any securities or other products.

Active Power Inc: ‘Disruptive Technology’ Not So Revolutionary After All

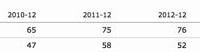
Summary Flywheel technology has been much hyped as the next big thing in the UPS space, although batteries have prevailed as the dominant solution. Wider market acceptance of flywheel technology would not necessarily result in upside, due too immense competition in a business where reliability and economics of scale are key. Significant loss of market share on a relative and absolute basis invalidates the bull thesis. Rapidly deteriorating financials in the most recent years suggests that their competitive situation has only become worse. 3x book value for a company that has never been profitable and has a declining top-line is just too much, a market cap at liquidation value is more appropriate. The first impression one gets from reading all the information on Active Power, Inc.(NASDAQ: ACPW )’ website is one of a business with a great product that is at the cusp of gaining market acceptance, as soon as these darn datacenter-architects would finally realize the benefits of flywheel-technology. They make a compelling case, where it not for the fact that: The technology is about 20 years old and market acceptance would surely have already taken place if the product really were superior. Rather than being a scrappy start-up, the company is a tiny player in a relatively mature industry, where long-term customer relations and scale are key. While touting their product’s perceived benefits they basically conceded that it’s not working out by offering the same product utilizing legacy technology Active Power Inc. builds so-called Uninterrupted Power Supplies (UPS). A UPS is an electrical apparatus that provides emergency power to a load when the main power source fails. A UPS differs from an auxiliary or emergency power system or standby generator in that it will provide near-instantaneous protection from input power interruptions, by supplying energy stored in batteries, supercapacitors, or flywheels. The on-battery runtime of most uninterruptible power sources is relatively short (only a few minutes) but sufficient to start a standby power source or properly shut down the protected equipment. In essence, they serve to bridge the time-gap between the occurrence of a power-outage and the start-up of a backup generator. It is a typical value-add business, with the overall addressable market estimated to be in the area of ~17B, with the sub segment of relatively large scale UPS with more than 150 kVA, the market that Active Power is targeting, around 4.6B. Most of these UPS’ utilize batteries to store energy. Active Power’s UPS’ on the other hand use flywheel technology. Instead of storing chemical energy, like batteries do, flywheels are brought to spin very fast, storing kinetic energy in the process, which can then be converted to electrical energy if need be. The bull thesis in essence, is that flywheel UPS’s While having larger upfront costs, have lower lifetime costs, as the maintenance intervals are larger; Are “greener” compared to batteries, as the latter end up being toxic waste; While runtime lies in the area of 10-15 seconds for flywheel UPS, compared to ~15 minutes for battery UPS, usually only a few seconds would be needed until the backup generator comes on-line. Combined these factors would make the market gradually shift to flywheel technology. Back in reality, the company, which has been in business for 15 years and never made a profit, saw a shrinking top line. (click to enlarge) Source: Morningstar In their 2010 10-K they state that their addressable market at the time was in the area of ~1.8B, compared to 4.6B in 2014. Using their revenue numbers in these years implies that their market share has actually dropped from around 3.6% in 2010 to 1% in 2014. This certainly doesn’t support the bull thesis, although market statistics on UPS are scarce, and it’s unclear how much of this is attributable to flywheel UPS gaining (or losing) traction or if the company plainly can’t compete. The UPS market is highly concentrated, with the bulk of the market share lying with Schneider-Electric (OTCPK: SBGSF ) and Emerson (NYSE: EMR ), both 40B market-cap behemoths. (click to enlarge) Source: VDC research The scrappy up-start picture isn’t supported by the fact that both of these companies massively invested in flywheel UPS themselves, With Schneider-Electric having bought APC, the until then US-market leader in the UPS market and Emerson’s acquisition of Liebert. Both of these subsidiaries offered extensive flywheel UPS products . Though Emerson at some point in the recent past opted to discontinue their flywheel product line, suggesting that the flywheel sub segment may be even more concentrated with Schneider Electric than the overall UPS market. Bottom line, these findings are still ambivalent as to whether the flywheel technology has gained traction in the market, but the significant reduction in market share AND absolute sales suggests a severe competitive disadvantage in a market that has more than doubled in the past four years. If one chooses to buy one of these, one wants to be really sure it will work. The lifetime of UPS are in the area of 15-20 years, and incur significant recurring service costs and warranty coverage. The slightly lower life time costs of flywheel UPS compared to UPS cost is simply a negligible criteria for customers compared to the vendors ability and reputation to service their products regularly and guarantee warranty coverage. Source: VDC research In the case of Active Power, there is substantial uncertainty as to whether the company will even be around in 10 years time, which greatly reduces their value proposition vs their peers. Bigger is simply better in this market. Financials As stated before, the company has never made a profit during it’s lifetime. In the most recent years it has additionally seen rapidly deteriorating operating margins as seen below: (click to enlarge) Source: Morningstar Yet they publish slides like this titles “gaining momentum”: (click to enlarge) witness the momentum To stay afloat, they regularly dilute their share count every 2 years: (click to enlarge) Source: Morningstar In spite of rapidly deteriorating financials, massive loss of market share on a relative and absolute basis in a market that has seen huge growth and severe competitive disadvantages versus their large peers that offer a substantially better value proposition, the company still trades at 3x book value, with a market cap of around $50M. My best guess as to why this is the case, is that they make a good case to the investing world of their superior product and tell a good story of how the break-out is right around the corner. The facts however tell the opposite story. Most of their assets are in the form of current assets, which makes their book value a decent proxy for liquidation value, a more appropriate yardstick of what this company should be trading for, implying 60% downside. I’ve used several sources throughout this analysis, most notably the 10-K’s of Active Power Inc, Schneider Electric and Emerson, as well as some research papers on the flywheel vs battery UPS debate from Mitsubishi , Schneider , datacenter dynamics and VDC research . Financial data was taken from Morningstar. Editor’s Note: This article covers one or more stocks trading at less than $1 per share and/or with less than a $100 million market cap. Please be aware of the risks associated with these stocks. Disclosure: The author has no positions in any stocks mentioned, and no plans to initiate any positions within the next 72 hours. (More…) The author wrote this article themselves, and it expresses their own opinions. The author is not receiving compensation for it (other than from Seeking Alpha). The author has no business relationship with any company whose stock is mentioned in this article.