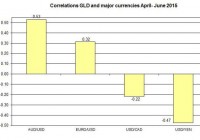
An established fund whose top holdings include premier global companies. The heaviest weightings have low volatility, are cyclically defensive and have above average dividend yields. The fund is diversified, yet intelligently structured with a strong defensive bias. Switzerland has been the financial safe haven for centuries and naturally, most people think of those legendary ‘Swiss Banks’. What goes mostly unnoticed, though, is their well-diversified export economy with global reach through premier companies. BlackRock’s iShares MSCI Switzerland Capped ETF (NYSEARCA: EWL ) offers perhaps the best product for a long term investment. First, the EWL’s fees and expenses are capped, although the prospectus does not seem to differentiate its management fees formula for capped or uncapped funds. The fund’s objective is to ” track the investment results of an index composed of Swiss equities” in particular, targeting 85% of the MSCI Switzerland 25/50 index of large and mid-cap companies. (click to enlarge) (Source: iShares) The fund’s nets assets are over $1.228 billion invested in 40 holdings. There are over 35.6 million shares outstanding and it trades an average of 115,744 a session. It currently trades at a premium of 0.79% to its Net Asset Value. The average P/E ratio of total holdings is 18.12. The average price to book is 2.39. The share’s beta is 0.79, i.e., it will move about 0.79 points for every 1 point market move, hence, it is less volatile than the aggregate market. The fund’s dividend return is 2.28% at 0.788 per share. The fund’s top holding is the consumer staples giant, Nestlé ( OTCPK:NSRGY ) at 16.0708% of the fund. Nestlé ‘s has 197 operations worldwide. It’s interesting to note that neither Consumer Staples nor food products account for a very large portion of Swiss exports. Coffee is largest percentage of any food export at 15th and 0.72% of total Swiss exports, then chocolate, 46th at 0.30% of Swiss exports. Nestlé’s business model utilizes a global production and distribution network. It procures, produces and distributes regionally from its factories located abroad: Europe has 136 locations, the Americas have 163 and Asia, Oceania and Africa, 143 combined. Hence, Nestlé is insulated from a strong Swiss Franc and can compete regionally. Nestlé is the only Consumer Staple in the top ten but the fund’s largest holding. Nestles ‘ ADR carries a 3.06% annualized dividend of $2.276, a P/E of 16.45, an EPS of 4.52 and a remarkably low beta of 0.521. Nestles sources ingredients responsibly, establishing minimum standards and product ‘traceability’ from 165,000 suppliers and 680,000 individual farmers. Nestles prides itself on its environmental and sustainability requirements. For example, Nestles is currently upgrading its California bottling plants to operate as a ‘zero water use facilities’. (Source: iShares) The second largest holding is Novartis (NYSE: NVS ), at 15.3964% and third, Roche Holdings ( OTCQX:RHHBY ) at 12.9567%. Again, it’s important to note some basic facts of these two premier healthcare companies. Novartis pays an annual 2.33% dividend of $2.259 per share, has a P/E of 23.38 and a low market beta of 0.77. Novartis produces Cardio Metabolic, Retina, Respiratory and Oncology therapeutics. Two familiar subsidiaries are Alcon, the eye care products company and Sandoz, the generic drug manufacturer. Roche ADRs carry a 2.83% annual dividend yield of $1.004, has a P/E of 26.38 and a market beta of 0.5. In addition to diagnostics and screening solutions, therapeutics drugs produced by Roche target Diabetes, Hepatitis, Leukemia, anti-rejection, and West Nile Virus to name a few. Lastly, as it is with Nestles, Novartis and Roche are, philanthropic, socially responsible and have strong sustainability and environmental impact policies. In total 39.5784% of the funds top 10 holdings are in Healthcare, and account for 88.91% of total Healthcare holdings. Financials comprise 20.33% of the fund’s holdings. Financials in the top ten include, UBS Group (NYSE: UBS ), 4.6014%, Zurich Insurance Group ( OTCQX:ZURVY ), 4.0688% ; Credit Suisse (NYSE: CS ), 3.7144% and Swiss Re ( OTCPK:SSREY ) 2.8509%. That works out to 21.267% of the fund’s top ten holdings and 74.941 of the fund’s total financial holdings. The funds motif carries over to the financials also. They have good dividends, low market volatility and concentrated in the top holdings. UBS is a global investment bank as well as wealth and asset managers with offices in 24 countries and all major financial centers worldwide. UBS carries a dividend yield of 2.53% at $0.53 annually, has a P/E of 16.23 with a beta of 1.02 Zurich Insurance provides retail and corporate insurance coverage across the entire spectrum of insurance products in over 170 countries. Zurich Insurance Group carries a dividend yield of 5.50% which works out to nearly $17.00 at its current $308.00 ADR price, has P/E of 11.78 with a beta of 0.399 Credit Suisse provides investment banking and asset management services for high net worth private clients in 50 countries. Credit Suisse has a dividend yield of 2.72% at $0.7464 annually, has a P/E of 22.80 and a beta of 1.08 Lastly, Swiss Re is a leading global reinsurer in 23 countries. Swiss Re has a dividend yield of 4.70% at $4.25 annually, a P/E of 37 and a market beta of 0.97. It’s important to note that according to the WTO , Switzerland’s commercial service exports, which includes financial and insurance services accounts for $93.421 billion or 2.01% of all global services exports. Industrials comprise 11.53% of the fund with only one representation in the top ten, ABB LTD (NYSE: ABB ). At 4.35% of the fund’s holdings, that accounts for 37.728% of all industrial holdings and 6.07% of the top ten holdings. ABB ‘s main focus is on electrical-mechanical equipment. This includes power transmission equipment, surge protection, motors, generators, transformers and linear controllers. ABB provides services and equipment for renewable energy infrastructure, electric vehicle systems, network management and marine transport. Because of its experience and focus on energy transmission, ABB’s has extraordinary growth potential in emerging markets as well as in some advanced economies whose power transmission infrastructure is in need of upgrading. The company’s annual dividend is 2.60% at $0.59 per share, a trailing P/E of 19.38 and beta of 1.14. Syngenta (NYSE: SYT ) is a global biotechnical agricultural products and seed producer located in 90 countries. The company focuses on sustainability, their motto being, “Bringing Plant Potential to Life” . Syngenta focuses on efficient crop production with higher yields and cost savings. At 3.71%, Syngenta accounts for 42.546% of all Materials holdings and 5.179% of the top ten holdings. Once again a closer look reveals an annual dividend yield of 2.33% at $1.95, a P/E of 24.01 and a market beta of 0.71. Lastly, COMPAGNIE FINANCIERE RICHEMONT ( OTCPK:CFRUY ) , at 3.84% of total holdings is most definitely a Consumer Discretionary company, producing unique ‘quality crafted’ luxury products with global distribution. Some of the more familiar names in the product line are Cartier, Alfred Dunhill, Chloé and Piaget . Richemont comprises 5.36% of top ten holdings and 67.605% of all consumers discretionary in the fund. Simply put, its products target the ‘high-end’ retail market, usually immune to cyclical downturns. The annual dividend yield is 1.03% at $0.847 per share, a somewhat high P/E at 34.74 and a market beta of 1.256. (Source: iShares) The fund is concentrated in its top ten holdings, containing 88.91% of all Health Care, 74.94% of all financials, 85.30% of all consumer staples, 37.728% of all industrials, 42.546% of all materials and 67.605% of all consumers discretionary. Telecommunications, 1.46% of the fund and Energy, 0.80% of the fund do not factor into the top ten holdings. A few other telling statistics of the top ten holdings is the average dividend yield of 2.963%, an average P/E 23.215 and an average beta of 0.8366. Compare this with the average S&P P/E of 21.47 and 1.99% dividend yield. (click to enlarge) (Source: iShares) One caveat: There is a slight currency risk. Switzerland traditionally keeps a strong free float currency and presently its ‘safe haven’ reputation has created demand for its currency and bonds. When a currency weakens against its trading partners, exported products become less expensive. Conversely, if the currency strengthens, exported products become more expensive. The above mentioned Swiss manufacturers had the foresight to utilize a global, material procurement, production and distribution network model, thus avoiding pricing skewed by Swiss Franc currency fluctuations. To be sure, there are other Switzerland focused funds. One of those listed in Seeking Alpha’s ETF hub is the First Trust Switzerland AlphaDEX® Fund (NYSEARCA: FSZ ) . The First Trust’s holdings are heavily weighted towards financials at 32.6% with 14.92% in the top ten. Similarly, 24.07% of the fund’s total holdings are industrials with 11.71% in the top ten. Materials and Consumer discretionary combined, comprise 19.38% of the fund with 7.31% in the top ten. In total, over 76% of total holdings are cyclically sensitive. Essentially, those companies comprising the First Trust Fund are the same companies as in the iShares Swiss focused fund, however the critical feature is the structure of the funds. The weighting of each are nearly inverses of each other. FSZ, by its structure, will have higher cyclical volatility. A second alternative is the Swiss Helvetia Fund (NYSE: SWZ ) . The fund’s website does list the top ten holdings but not the fund’s entire holdings. Judging by the top ten heaviest weighted holdings, SWZ is defensively weighted with healthcare giants Novartis and Roche topping the list followed by consumer staples manufacturer Nestles , followed by the famed Chocolatier Lindt & Spruengli ( OTC:COCXF ). The more cyclically sensitive UBS, Credit Suisse and Swatch group ( OTCPK:SWGAY ) comprise a lesser portion of the top ten holding. It should also be noted that the Helvetia Fund has recently changed its managing advisors. Switzerland has about 50 world class companies so all three funds contain the same companies, more or less. The key is in each fund’s structure. iShares Switzerland focused fund EWL is as carefully crafted as a Swiss timepiece. It weights the best of all worlds: Growth, Dividends and Low Volatility. SWISS ETF Comparison Table 1 month 3 months 1 year 5 years EWL -2.64% 3.81% -2.15% 68.75% FSZ -3.06% 3.84% -5.63% 36.21% SWZ -3.28% 5.56% -17.62% 11.56% (Source: combined) In summary, the iShares MSCI Switzerland Capped ETF ( EWL ) is diversified through globally positioned, cyclically defensive companies and does so without sacrificing growth. All said and done the iShares Switzerland capped ETF is ideal for the investor with a long term view. Editor’s Note: This article discusses one or more securities that do not trade on a major U.S. exchange. Please be aware of the risks associated with these stocks. Disclosure: I/we have no positions in any stocks mentioned, and no plans to initiate any positions within the next 72 hours. (More…) I wrote this article myself, and it expresses my own opinions. I am not receiving compensation for it (other than from Seeking Alpha). I have no business relationship with any company whose stock is mentioned in this article. Additional disclosure: CFDs, spreadbetting and FX can result in losses exceeding your initial deposit. They are not suitable for everyone, so please ensure you understand the risks. Seek independent financial advice if necessary. Nothing in this article should be considered a personal recommendation. It does not account for your personal circumstances or appetite for risk.