Tag Archives: author

Recent Sell: Target Corporation

There’s a time to buy and a time to sell. My reasons for selling seemed rational. Don’t rely on your emotions to make investment decisions. Having a pre-arranged selling plan can be helpful when a decision to sell needs to be made. As a dividend growth investor I look for and buy stocks that appear to be a good value and have a descent dividend growth. However, it doesn’t mean I will buy and hold any particular stock in perpetuity. There comes a time when a particular stock no longer lives up to my expectations and the decision to sell has to be made. This is what has happened in my case when it came to Target Corp. (NYSE: TGT ). I had owned TGT since October 2013 which was a few months before the big data breach. Originally, I had bought the stock in the mid $60s range. As the stock fell into the mid $50s I purchased some more. I ended up with the stock at a cost basis of $61.67. As you may know, the stock started sliding after the data breach was made public and it bottomed at $55 in early February 2014. The stock meandered between $55 and $62 for much of the rest of the year until November 2014. Then it gapped up and headed north to about $77.50. Since then it has backed off to the $75 range. This is the point at which I decided it was time to exit. In the life of any investor it is just as important to know when to buy as when to sell. Buying and then forgetting about a stock could cause you much pain and suffering in your portfolio. There are numerous examples that could be referenced. Remember Enron, World Com, General Motors (NYSE: GM ), Lehman Brothers, Kmart, and etc. Many who held on to these stocks were wiped out. As the song goes, “You have to know when to hold them and know when to fold them”. I will now try and delineate why I decided to sell. Hopefully, the exercise will help both of us to be better investors. Target has no economic moat. There is no doubt it is a well known brand and has been in business some 50 years. The company now boasts a network of over 1800 stores. However, there is serious competition from the likes of Wal-Mart (NYSE: WMT ), Kroger (NYSE: KR ), Costco (NASDAQ: COST ) and online vendors. It really doesn’t have any great advantage over any of its competitors. Target’s price for several reasons is a bit stretched. Morning Star puts the Fair Value price in the mid $60s. On the technical side the price is far away from both the 200 and 50 day simple moving averages. Target’s current P/E ratio is north of 30. And the question in my mind is whether earnings are going to be better near term or get worse. There is still the question of how much the exit from the Canadian market will impact Target’s earning later this year. Also, there is the question of organic growth near term. I don’t see any particular catalyst that will drive growth higher. The dividend yield is now 2.75%. For me this is not acceptable. I need yield greater than 3.5% to achieve my investment goals. The growth in the dividend has been good up to this point. Last year’s dividend was increased by almost 21%. The current payout ratio is about 80%. I don’t believe the dividend growth rate will continue at such a high level. Earnings will be a key to whether dividend growth can be sustained at such high levels. The unrealized gain was the straw that broke the camel’s back. Before I sold, I had roughly 6 years of accumulated dividends sitting in my unrealized gains. As the old say goes, “a bird in the hand is worth two in the bush”. Basically, the decision came down to this, sell Target before my gains evaporated and use the money to fund a position that will meet my investment goals. It the moment I am looking a Tupperware Brands Corp.(NYSE: TUP ), StoneMor Partners (NYSE: STON ), Royal Dutch Shell (NYSE: RDS.B ), or Alliance Resource Partners (NASDAQ: ARLP ). Of course, it is not for me to say what you should do with Target. Each of us has our own wants, needs, and expectations when it comes to investment decisions. But, what is important for all of us, I believe, is to have a rational reason for buying and selling. Having a plan in place ahead of time will make that decision easier and help all of us to become better investors. If we don’t have a prearranged plan we will end up relying on our emotions or a hot tip from the barber. And, that kind of investing is sure to bring disaster to anyone’s portfolio. Additional disclosure: I’m not recommending anyone buy any stock mentioned in this article. This article is intended for educational purposes only.
Southern Company Retains Appeal For Long-Term Investors

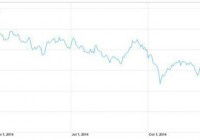
Summary Southern Company’s near-term may remain overshadowed due to ongoing construction projects. Ongoing capital expenditures will fuel rate base and long-term earnings growth. Attractive dividend yield of 4.1% makes SO a good investment for dividend-seeking investors. Southern Company (NYSE: SO ) is one of the leading energy companies in the U.S. utility sector. The company’s solid fundamental outlook is supported by its accelerated capital expenditures for several energy projects. In the near term, the company’s stock price can come under pressure due to its risk in delay and cost overruns for its ongoing projects, Kemper and Vogtle. But in the long run, once these projects are completed, they will help the company grow its rate base and fuel earnings growth. Also, as the company’s capital expenditures have been fueling its EPS growth, it will also fuel dividend growth for the company in the future. Currently, the stock has a dividend yield of 4.1%, which makes it attractive for dividend investors. Also, the low treasury yield environment will support the utility sector and SO’s performance in 2015. The following graph shows the low U.S. 10-year treasury yield. (click to enlarge) Source: Yahoo Finance Investors Have a Secure Long-Term with SO The company has been making capital expenditures to strengthen its electricity generation portfolio. Capital expenditures, which the company is making, are focused towards regulated operations, which will provide stability to its cash flows and earnings. The capital expenditures will also fuel long-term earnings growth for the company. As far as SO’s 582MW Kemper project is concerned, the project has been subjected to ongoing cost revisions and delays, and the issues of delays and cost overruns still prevail. As per the revised estimates, the project’s total cost will now reach $6.1 billion, an increase of $330 million as compared to previous estimates. However, the project is near completion and is expected to be completed by the end of 1H’15. In addition, the company is in the process of building two new nuclear power plants, Vogtle 3 and 4, with a power generation capacity of 2,200MW . These nuclear projects were previously estimated to be in running condition by the end of 2017 or 2018, but as per recent revisions, these projects are also expected to face operational delays. The Vogtle project is expected to experience a one-year delay and cost an additional $730 million to the company. Owing to these ongoing delays and expected cost increases, I believe the project will remain an overhang on its stock price performance in the near term. But in the long run, these projects will uplift SO’s production capacity and optimize its generational portfolio, which will help grow its rate base and earnings. In addition to these power generation projects, the company is bidding on the growth potentials of solar energy projects. SO is building a 131MW solar farm in Georgia, which is expected to be operational in 2016. The value of building this farm lies in generating healthy earnings growth for the company, by selling generated electricity to corporations through long-term power purchase contracts. Moreover, the company’s subsidiary Southern Power has accelerated acquisitions to improve the overall power generation capacity and to fuel its long-term earnings base growth. Southern Power won a bid for 100MW of solar projects in Georgia, and the subsidiary acquired the 150MW Solar Gen2 and 50MW Macho Spring solar facility. The company’s robust capital expenditures for future years will add to its rate base and long-term earnings growth. The company has plans to make capital expenditures of $17.4 billion from 2014-2016. The following chart shows the company’s expected capital expenditures for future. (click to enlarge) Source: Company’s Quarterly Earnings Report The company’s efforts to expand and strengthen its electricity generation portfolio will portend well for its long-term operational performance, and the capital expenditures will fuel its long-term earnings growth. Analysts are expecting a decent next five-year earnings growth rate of 3.63% for the company. Rewarding Investors SO has a strong history of rewarding its shareholders through healthy dividend payments. The company has a solid cash flow base to support its ongoing dividend increases. SO has recently announced a quarterly dividend payment of 52.50 cents . Currently, SO offers a high dividend yield of 4.10% , which is well covered by its cash flows, as indicated by the company’s strong dividend coverage ratio (Operating cash flows/ Annual Dividends) below. Based on the growth potentials of ongoing capital expenditures and large scale dependence on regulated operations, SO’s cash flow base will continue to grow at a decent pace. And owing to the company’s secure cash flow base, I believe SO’s dividends are secure and sustainable in the long run. The following table shows the company’s healthy dividend per share, dividend coverage and dividend payout ratio in the past three years, and for 2014 and 2015, based on estimates. Dividend Per Share Dividend Payout Ratio Dividend Coverage 2011 $1.87 73% 1.4x 2012 $1.94 73% 1.4x 2013 $2.01 75% 1.3x 2014(NYSE: E ) $2.10 74% 1.3x 2015( E ) $2.17 74% 1.3x Source: Company’s Annual Reports and Equity Watch Estimates Risks The company’s earnings growth faces risks of regulatory restrictions at the federal or state level, and an increase in environmental expenditure as directed by the EPA. Also, an increase in interest rates poses a risk to the stock price. Moreover, economic weaknesses in SO’s service territory are causing lower demand growth. Significant cost increases and delays due to the construction of Kemper and Vogtle plants, and unfavorable weather are key risks to the company’s future stock price performance. Conclusion The company’s near-term may remain overshadowed due to ongoing construction projects, but in the long run, as the construction projects will be completed and its generational portfolio will improve, its operational performance and stock price will be positively affected. The ongoing capital expenditures will fuel its rate base and long-term earnings growth. And as the company has significant regulated operations, it will portend well for its earnings and cash flows stability. Also, an attractive dividend yield of 4.1% makes it a good investment for dividend-seeking investors. Due to the aforementioned factors, I remain bullish on this stock.

Why Muni Closed-End Funds May Not Do Well In 2015

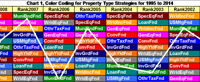
Summary CEF Muni funds from 1995 to 2014 that show in 2007 and 2011 that highest number has gone down 2 to 3 years to the lowest number. High-Leveraged and Low Leverage, what is the difference? Hedge Funds for municipal bonds. European Central Bank : Since the financial crisis in 2008, the U.S. Federal Reserve, the Bank of England (BOE), and the Bank of Japan (BOJ) have each utilized quantitative easing. Then on Thursday January 22, Mario Draghi revealed that the European Central Bank (ECB) plans to purchase over €1 trillion ($1.157 trillion) in European public and private sector bonds by the fall of 2016. This means purchasing €60 billion a month of government bonds, debt securities issued by European institutions and private sectors bonds. Though the jury is still out regarding the effectiveness of such measures, as of now it is “all over, but for the shouting”. While this policy is expected to push down European yields, rates in the U.S. will likely be moving in the other direction by year-end. So, what does all of this monetary policy mean for CEF Municipal Bond Funds? (click to enlarge) CEF Strategies from 1995 to 2014 : GrowthIncome has provided a table below plotting the annual performance for 11 Closed-End Fund sectors from 1995 to 2014. Each column is ordered from best to worst annual performance. This table also contains a line connecting the position of the MuniBndFnd (Municipal Bond Funds) sector for each year. As you see, MuniBndFnds fund types have its year-to-year rankings both above-and-below its previous year-as with all other fund types strategies As you can see in the left most column of the chart, the MuniBndFnds sector provided the best returns during 2014. MuniBndFnds were also at the top of the list in 2007 and 2011. Yet, in subsequent years (2008 and 2012), the sector plunged from number 1 to number 6, and then even further to the bottom of the pile within the next 2-3 years (2010, 2013). So, if history is any indication, it would be wise to take a closer look at MuniBndFnds after it was the best performing sector the year prior. Municipal Closed-End Funds : There are approximately 181 municipal (national and state) Closed-End funds. On average, MuniBndFnds are leveraged at 33.7%, have a 5.5% tax-free yield, a discount of -6.6%, and a 1.1% baseline fee. The market cap average is $327 million. MuniBndFnds: High & Low Leveraged: To understand this sector a bit better, GrowthIncome has put the 5 highest leveraged funds and the 5 lowest leveraged funds into 2 separate groups: 5 High-Leveraged and 5 Low-Leveraged . Chart 2 contains the results of subtracting the averages of the 5 Low-Leveraged group from the 5 High-Leveraged group. Specifics for each fund and the averages for each group can be found in charts towards the end of the report Subtracting 5 Low-Leveraged from 5 High-Leveraged : Subtracting the averages of the 5 Low-Leveraged group from the 5 High-Leveraged group results in a distribution yield of 2.3% (High: 6.4% – Low: 4.1%) and a leverage of 41.4% (structural leverage: 35.0% and effective leverage: 6.4%). A few other metrics of note are Basic Expense, Interest Expense, and Annual Expense Ratio which come in at 0.91%, 0.12% and 1.03%, respectively. It seems 5 High-Leveraged funds have a portfolios coupon advantage. The coupon between 5 High-Leveraged versus 5 Low-Leveraged is 2.2% (High: 5.2% – Low: 3.0%). This is most likely a result of the 5 High-Leveraged group placing 13.6% of their portfolios in “unrated” municipal bonds while the 5 Low-Leverage group placing only 3.5% (a subtraction of 10.0%). UNII : The Undistributed Net Investment Income (UNII) of the High-Leveraged group is $0.0964 minus the UNII of the Low-Leverage group of $-0.006 results in a UNII of $0.1024 per share. So, the High-Leveraged MuniBndFnds have much more UNII than the Low-Leveraged funds. Dividend Cuts : Of the 5 High-Leveraged funds, only 1 cut their distribution in 2014: PIMCO CA Municipal Income II (NYSE: PCK ) . The 2014 monthly dividend rate dropped from $.0625 to $0.538, a 13.9% decline, in May. However on the Low-Leveraged side, 4 of the 5 funds cut distributions in 2014. The only fund that didn’t was Nuveen CA Muni Value (NYSE: NCA ). Nuveen Select Tax-Fee Income (NYSE: NXP ) cut it monthly distribution in 2014 once by 7.6%. Three (3) funds cut their distributions 2 times in 2014. This was Nuveen Select Tax-Free Income 2 (NYSE: NXQ ) by 12.4%, Nuveen Municipal Value (NYSE: NUV ) by 6.8% and Nuveen Select Tax-Free Income 3 (NYSE: NXR ) by 6.7%. Auction-Rate Preferred Shares : Each of the 5 High-Leverage funds uses Auction-Rate Preferred Shares (“ARPS”) for their structural leverage. Since mid-February 2008, holders of auction-rate preferred shares (“ARPS”) issued by the CEF’s have been directly impacted by a lack of liquidity. These funds have consistently “failed” because of insufficient demand to meet the supply of such securities. However, as their “failure” to issues such securities, the penalty rates for the securities is a average “maximum rate” equal to the higher of the 30-day “AA” Composite Commercial Paper Rate multiplied by a minimum of 110% or the Taxable Equivalent of the Short-Term Municipal Obligations Rate-defined as 90% of the quotient of (A) the per annum rate expressed on an interest equivalent basis equal to the S&P Municipal Bond 7-day High Grade Rate Index divided by (B) 1.00 minus the Marginal Tax Rate (expressed as a decimal) multiplied by a minimum of 110% (which is a function of short-term interest rates). However, the interest rates on “ARPS” have been below 0.25% points for the hundreds of millions of dollars to “ARPS” debt. This debt is highly accretive to leveraged funds. As with PIMCO NY Municipal Income II (NYSE: PNI ), the average EPS as it related to the dividend is -11.6%. This may be out of line for the High-Leveraged CEF’s. PNI premium is 6.9%. (click to enlarge) Low-Leverage Funds : Nuveen manages each of the 5-Low-Leveraged funds, which have an average coupon rate much lower than that of the 5 High Leverage d funds. This may be due to the level of unrated municipal bonds between the two groups. 3 of the 5 High-Leveraged funds are state municipal funds whereas the Low-Leverage funds only have 1. However, the two High-Leveraged funds that are national have an average 5.1% coupon while the 4 national Low-Leveraged funds have an average 2.8%coupon. It’s seems to me that Nuveen, which has a slew of municipal bonds, may not be paying attention to their holdings. (click to enlarge) Hedge Funds : If interest rates go up at the end of the year, both High and Low Leveraged Closed-End Funds will likely go down so. If you don’t have a “hedge” against MuniBndFnd your stock losses may mount up. We have Muni tax-free ETF known as iShares National AMT-Free Muni Bond (NYSEARCA: MUB ). MUB has a $4.12 billion net assets value (NAV), a 2.7% tax-free yield and a 0.25% expense ratio. Additionally, we have taken a counter indicator to the MUB call ProShares Short 20+ Year Treasury (NYSEARCA: TBF ) . This may cancel out each other when the stock price moves. TBF has a Net Asset Value of 1.06 billion with a 0.92% expense ratio with no dividends. Joe Eqcome, GrowthIncome Research & Management, LLC