Tag Archives: author

Top-Rated Stock Picks and Most-Read Stories at Nasdaq.com: Feb. 1-7, 2015

Welcome to the latest installment of community stock picks and overview of the most-read stories of the week. We’re taking a look at stocks chosen by members of the Nasdaq.com community from February 1 – 7. Bullish Stocks: Here’s What You Said: SolarCity ( SCTY ): Industry sector growing. GoPro ( GPRO ): Just

Are Some Decisions To Allocate To U.S. Equities Due To Survivorship Bias?

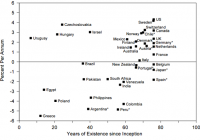
By David Foulke The CFA Institute Magazine recently published an interview (a copy is here ) with C. Thomas Howard, CEO of Athena Investment Services. Howard has some pretty explicit views on why investors should allocate all of their assets to U.S. stocks: The primary driver of long-horizon wealth is expected returns. Why would you invest in anything but stocks? Why isn’t your portfolio 100% stocks? Do you believe stocks are going to have the highest return? By the way, stocks have averaged 10% a year for a long period of time. Bonds have averaged about 6%. The difference between a portfolio that’s 100% stocks and one that is a mixture of stocks and one that is a mixture of stocks and bonds over long periods of time is huge, possibly millions of dollars. Why would I want to buy anything but the highest expected return, asset-wise? U.S. stocks have offered the best returns for a long time, and therefore the U.S. stock market is where you want to be invested. This is an interesting argument. Certainly, Howard is right that the U.S. stock market has been the best place to be invested. For instance, Mehra and Prescott in their 1985 paper, “The Equity Premium Puzzle” (a copy can be found here ), demonstrated how the risk premium on U.S. Equities from 1889-1978 averaged roughly 6%. The paper was notable in that it suggested that existing general equilibrium models were unable to explain the size of this premium, which was dramatically higher than for other economies. Academics struggled to explain the persistently strong U.S. stock market. This is the “puzzle” to which the paper’s title refers. In 1998, Reitz proposed that investors in U.S. markets might be more risk averse due to the potential occurrence of large drawdowns, or “crashes.” In a risky market that could crash dramatically, risk averse investors might expect high equity returns as compensation for bearing the risk of such crashes. Perhaps this explained high returns in the U.S. As academics pondered the effect of possible crashes on risk premia, they increasingly questioned that it was risk aversion to crashes that was driving returns. Some thought these unexplainable returns might have something to do with whether a market simply survived, which by definition meant that it consistently recovered from periodic drawdowns over long time frames. Was their some bias introduced to a market’s returns that was associated with the mere fact of its survival? In their paper, “Global Stock Markets in the Twentieth Century” (a copy can be found here ), the authors Jorion and Goetzmann explored this question. They examined 39 global stock markets from 1921 through 1996 and, as before, saw evidence of the outperformance of the U.S. stock market, which provided a real return of 4.32% over the period, the highest of all countries. During this period, however, several of these 39 markets experienced interruptions to their functioning, caused by forces such as war, political instability, hyperinflation, and so forth. The authors compared what happened when they considered both “loser” markets, and how long they were viable, in addition to the survivors, like the U.S. and others, who were “winners” over long periods. The figure below plots annual returns against the length of the history of each market: (click to enlarge) There appears to be a clear relationship between returns and longevity of markets, with longer-lived markets generating higher returns. Over the period, the median return for all 39 countries was 0.75%, representing the return earned by holding a globally diversified portfolio since 1921. Notably, there were 11 “winner” countries, which had continuous returns going back to 1921. For this group, the median return was dramatically higher, at 2.35%. Also, note that the U.S. appears at the upper right of the figure. These results suggest that returns for the U.S. 1) are uncommon at 4.3% versus 0.8% for all other countries, and 2) could be explained by survival, as could higher returns for the other survivors. If you happened to invest in a country that survived, you would have earned higher returns. The paper also examined Reitz’s hypothesis. Recall that Reitz had suggested that investors demanded a higher return as compensation for the risk of a crash. If this were true, then you would expect to see the “losers” exhibit higher equity premia. As the figure above illustrates, the opposite appears to be the case. A regression of these points would slope upward to the right. The returns of the winners may thus be conditional on their survival. If you think about investing in a particular country as like drawing a ball from an urn, then how meaningful is it to say that we can expect future returns to resemble past returns in that country, if those past returns are a result of survivor bias? Survivor bias refers to how we can focus on survivors in a data set, and ignore failures, which provide additional information about risk. Hindsight may be 20/20, but predicting the future is not, and if we condition on only the surviving winners, we ignore the possibility that we may be investing in a previous winner that may turn into a loser in the future. In a PBS interview (a copy is here ) Jack Bogle stated the following: Good markets turn to bad markets, bad markets turn to good markets. So the system is almost rigged against human psychology that says if something has done well in the past, it will do well in the future. That is not true. And it’s categorically false. And the high likelihood is when you get to somebody at his peak, he’s about to go down to the valley. The last shall be first and the first shall be last. Indeed, why should it be easy to predict which markets will survive? As Bogle points out, it may be precisely the past winners who are about to fail. Or as Jeremy Siegel stated in his paper, “The Equity Premium: Stock and Bond Returns since 1802”: Certainly investors in…1872…did not universally expect the United States to become the greatest economic power in the next century. This was not the case in many other countries. What if one had owned stock in Japanese or German firms before World War II? Or consider Argentina, which, at the turn of the century, was one of the great economic powers. It’s probably likely that Argentinian investors predicted continued economic dominance at the turn of the century. They were wrong. The outcome of World War II, which today looks obvious, could have played out in many different ways, and the U.S. might very well have turned into a loser. The Japanese certainly thought they would emerge as the dominant power after the war, or they wouldn’t have fought the war. Same for Germany. If the outcome of WW II had been different, we might today be studying the stock markets of Japan, Germany or other European countries, instead of the U.S. Who is to say the U.S. will not enter a hyperinflationary period or a sustained major war? Such an outcome for the U.S. is obviously not without precedent elsewhere. When we look at past U.S. returns, we are looking at a market that did not fail, but does it follow that it cannot fail in the future? Conditioning on past survival can subject investors to risks, which they are not accounting for. Even with strong past returns, we need to consider survivor bias, and that we are necessarily betting on a winner. Interestingly enough, Warren Buffett and Jack Bogle offer investors puzzling investment advice in the face of the results presented by Jorion and Goetzmann and a simple knowledge of survivor bias. First, Warren’s advice: Put 10% of the cash in short-term government bonds and 90% in a very low-cost S&P 500 index fund. (I suggest Vanguard’s.) Next, Jack Bogle’s advice : I wouldn’t invest outside the U.S. If someone wants to invest 20 percent or less of their portfolio outside the U.S., that’s fine. I wouldn’t do it, but if you want to, that’s fine. We have to question whether the advice from Buffett/Bogle considers the reality of survivor bias or their own personal bias. Original Post

El Paso Electric – A Regional Utility Worth Considering

Summary The utilities sector declined nearly 4% on Friday amid strong hiring news. El Paso Electric is now trading at under 18X earnings, cheaper than S&P 500 and Dow Utility Index. After a hiatus beginning in the late-1980s, El Paso Electric is again making dividend payments, including its most recently announced .28/share payment, its 16th straight quarter. Largest market is El Paso in Texas, which is viewed as a pro-business positive net-migration state. Decision not to participate in the renewal of aged coal power-generating plant reflects the modernization and commitment of the Company to provide sustainable long-term energy production. El Paso Electric (NYSE: EE ) is a regional electric utility company that provides generation, transmission, and distribution service to the southwestern United States and Northern Mexico. Its 10,000 square mile service area includes parts of Texas, New Mexico, and two connections to Juarez and the Mexican national utility, Comision Federal de Electricidad. The Company’s principal industrial and large customers operate in the steel production, copper, oil refining and defense industries (including Fort Bliss Army Base and White Sands Missile Range). El Paso Electric’s net dependable generating capability of 1,852 megawatts. Key events and catalysts – A substantial portion of the Company’s fossil fuel generation facilities are over 50 years old. Over the last five years, El Paso Electric has spent nearly $1 billion dollars for the replacement of plant and equipment and for additional generation, transmission and distribution. – El Paso Electric constructed its first new plan in nearly 30 years, a 288 MW Newman 5 natural gas-fired combined cycle plant – Additional cap-ex expected to top $1.5 billion in the next five years – Due to favorable location in high desert and reduction in cost of solar panels, El Paso Electric has introduced significant utility scale solar generation at costs competitive with fossil fuel alternatives – The Company’s Montana Power Station (a $372 million local generation facility) is expected to go on-line by summer of 2015 – El Paso Electric will not participate in extending the operation of the nearly five decade old coal-fired Four Corners Power Generating Station after its scheduled retirement in July 2016. – New Mexico rate case finalization in April 2015 and Texas rate case finalization in August 2015 will seek to recapture costs related to construction, load growth and facility retirement Service Area (Source Annual Report) (click to enlarge) While the population of the state of New Mexico grew a paltry 1.3% from April 2010 – July 2013 (compared the US as a whole – 2.4% – most recent data available from Census Bureau), the state of Texas grew 5.2%, more than double the national rate. Power Generation Station Primary Fuel Type Owned Net Dependable Generating Capacity (NYSE: MW ) Ownership Interest Location Palo Verde Station Nuclear 633 15.8% Wintersburg, Arizona Newman Power Station Natural Gas 732 100% El Paso, Texas Rio Grande Power Station Natural Gas 316 100% Sunland Park, New Mexico Four Corners Station (Units 4&5) Coal 108 7% Fruitland, New Mexico Copper Power Station Natural Gas 62 100% El Paso, Texas Renewables Wind/Solar 1 100% Hudspeth/El Paso Counties, Texas Total   1,852     (Source: Most recent annual report) Notes on power generation: – The Nuclear Regulatory Commission renewed the license of all operating units at Palo Verde which now expire between 2045 – 2047. – The estimated decommissioning costs related to the Palo Verde plant is $381 million. El Paso Electric’s trust fund had a $214 million at 12/31/13. – The 50-year participation agreement among the owners of the Four Corners Station expires in July 2016. El Paso Electric has informed the other owners that it has decided to cease it participation in the plant by July 2016 opting for more economical and cost effect energy alternatives. Customer growth Growth Rate Since 2009 Total growth: 29,335, 1.5% per year Residential growth : 25,482, 1.5% per year (click to enlarge) Customer growth has been positive since 2009, but at a very modest rate in total. Earnings per share EE Net Income (NYSE: TTM ) data by YCharts While earnings per share and net income are generally positive trending over the past decade, El Paso Electric has seen drop-offs in the last several years as decommissioning and other costs have outweighed rate and customer increases. El Paso Electric’s continued profitability hinges on its ability to successfully manage delivery and production costs in a rate-regulated environment. Last Friday, positive hiring news led to declines in “safe-haven” assets including gold, bonds and utilities stocks. El Paso Electric shares fell 4.34%, consistent with sector declines. The Company now trades at 17.72x TTM earnings , which is a lower multiple than the S&P 500 (20.03x) and the Dow Jones Utility Index (19.63x). Reliance on nuclear sourced power   2013 2012 2011 2010 2009 Nuclear 46% 46% 45% 45% 45% Natural Gas 34% 32% 30% 27% 22% Coal 6% 6% 6% 6% 7% Purchased Power 14% 16% 19% 22% 26% Nuclear power makes up a substantial portion of the Company’s sourced electricity. Despite the recoverability of fuel costs for nuclear power generation, it is still expensive and can result in additional regulatory costs associated with production, waste storage and disposal. The Company current sources less than 1% of its power from solar, wind and other renewable sources, but continued investment in these alternative energy sources can help El Paso Electric to remain profitable and competitive. Weather and energy (click to enlarge) (Source: Investor Presentation) Demand for energy is in part driven by climate and weather patterns. As show above, cooling degree days (CDD) dipped below their ten year average for the first time since 2008, while heating degree days (HDD) days are down to levels not seen since 2006. Assuming global warming is real , it is not unreasonable to expect larger and more frequent temperature swings which could drive demand for electricity. Selected Ratio and financial analysis (all information from morningstar.com unless otherwise noted) Ratios and metrics   TTM 2013 2012 2011 2010 2009 Gross margin % 65.6% 67.5% 70.5% 67.5% 66.7% 64.4% Operating margin % 16.3% 18.6% 19.8% 20.8% 19.3% 16.1% Debt/equity 1.12 1.06 1.21 1.07 1.05 1.11 Book value per share 24.13 23.51 20.57 19.10 19.10 16.51 The Company’s gross and operating margins have been fairly consistent, while maintaining a health debt/equity ratio and increasing tangible book value per share. One risk facing the El Paso Electric is the continued availability of debt and equity financing for construction and other projects. Cash flow and dividends   TTM 2013 2012 2011 2010 2009 Operating cash flow 237M 247M 273M 252M 239M 269M Capital expenditures 326M 289M 269M 236M 224M 252M Free cash flow -89M -42M 4M 16M 15M 17M Dividends 1.09 1.05 .97 .66 – – Operating cash flow has been on the decline since 2012, which is not what I look to see from a utility. The Company is investing in business, growing capital expenditures each year since 2010, which hopefully will result in more attractive power generation, distribution, and delivery mechanisms. As previously mentioned, prior to 2011, El Paso Electric had not paid dividends since 1989. Since the reinstitution its dividend policy, the company has grown the total payout each year since 2011. Understanding the Mexico opportunity While El Paso Electric serves a limited geographic (southwestern United States and northern Mexico), it has a fairly diversified customer base within this region. According to El Paso Electric’s most recent annual report, no customer makes up more than 4% of non-fuel base revenues. Most of the energy distributed to the Comision Federal de Electricidad is consumed in Juarez, a city of 1.5 million. While Juarez has a reputation for crime and violence, the city represnts a solid investment opportunity for El Paso Electric as it has nearly doubled in population since 1990. Continued growth and modernization of Juarez will be a long term benefit to El Paso Electric’s bottom line. Leadership El Paso Electric announced Thursday that Chairman of the Board Michael Parks resigned to accept a job with a global investment management firm. Parks served on the board since 1996. He was replaced by long-time board member Charles Yamarone as the new chairman. Bottom line If I was looking for a moderate risk/reward small cap utility play, I would be satisfied owning El Paso Electric at current prices. It has a reasonable 2.8% forward yield , conservative 50% payout ratio, and is taking steps to move away from dirty energy and to cleaner renewable sources. There are a substantial number of utilities that offer higher yield, a longer and more consistent dividend history, and more years of profitability. El Paso Electric may be the right stock for your portfolio, but not the right stock, right now, but if you are on the fence and need a sign, put it on your watch list, and consider scaling into a position when any of the following occur: – Alternative energy as a percentage of net dependable generating capacity exceeds 10% of total. This would mean El Paso Electric has entered a new era of largely clean (natural gas and alternative) energy generation that could be a competitive advantage when the freeze-period expires and competition is introduced into EEs Texas service area. – Yield rises to 5% (but payout stays same or increases). For this to occur, El Paso Electric would need to be trading at $22.40 per share, or a dirt cheap 10.2X earnings. – All Coal and Nuclear operations are ceased and all decommissioning costs settled and final. This would remove substantial uncertainty and potential earnings volatility for intermediate horizon investors (3 – 5 years). Disclosure: The author has no positions in any stocks mentioned, and no plans to initiate any positions within the next 72 hours. (More…) The author wrote this article themselves, and it expresses their own opinions. The author is not receiving compensation for it (other than from Seeking Alpha). The author has no business relationship with any company whose stock is mentioned in this article.