Tag Archives: alternative

Considering SCHF For Foreign Exposure? Modern Portfolio Theory Can Use It
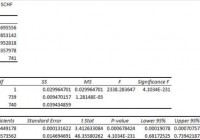
Summary I’m taking a look at SCHF as a candidate for inclusion in my ETF portfolio. The risk level is relatively high for just holding SCHF, but the correlation to the S&P 500 fixes that. The ETF has a solid dividend yield and diversified holdings. I’m not assessing any tax impacts. Investors should check their own situation for tax exposure. Investors should be seeking to improve their risk adjusted returns. I’m a big fan of using ETFs to achieve the risk adjusted returns relative to the portfolios that a normal investor can generate for themselves after trading costs. I’m working on building a new portfolio and I’m going to be analyzing several of the ETFs that I am considering for my personal portfolio. One of the funds that I’m considering is the Schwab International Equity ETF (NYSEARCA: SCHF ). I’ll be performing a substantial portion of my analysis along the lines of modern portfolio theory, so my goal is to find ways to minimize costs while achieving diversification to reduce my risk level. What does SCHF do? SCHF attempts to track the total return of FTSE developed ex-US Index. The ETF falls under the category of “Foreign Large Blend.” Funds within this category generally invest most of their assets in developed markets. Some will include a small exposure to emerging markets, but different investment managers have different definitions of which markets are “emerging” and which ones are “developed.” Does SCHF provide diversification benefits to a portfolio? Each investor may hold a different portfolio, but I use (NYSEARCA: SPY ) as the basis for my analysis. I believe SPY, or another large cap U.S. fund with similar properties, represents the reasonable first step for many investors designing an ETF portfolio. Therefore, I start my diversification analysis by seeing how it works with SPY. I start with an ANOVA table: (click to enlarge) The correlation is about 76%, which is low enough that I’m expecting to see significant diversification benefits. Standard deviation of daily returns (dividend adjusted, measured since January 2012) The standard deviation isn’t going to make a strong case for investing in SCHF. For the period I’ve chosen, the standard deviation of daily returns was 0.8955%. For SPY, it was 0.7300% over the same period. Clearly, SPY appears to be the safer of the two investments. Mixing it with SPY I also run comparisons on the standard deviation of daily returns for the portfolio assuming that the portfolio is combined with the S&P 500. For research, I assume daily rebalancing because it dramatically simplifies the math. With a 50/50 weighting in a portfolio holding only SPY and SCHF, the standard deviation of daily returns across the entire portfolio is 0.7865%. The risk level on the portfolio drops relative to only holding SPY because of the diversification benefits that come from the 76% correlation. If the position in SPY is raised to 80% while SCHF is used at 20%, the standard deviation of daily returns drops down to 0.7453%. In practice, I think the best way to use SCHF will be a position smaller than 20% and used in a more diversified portfolio. The low correlation makes a very strong case for using SCHF in a small position to enhance diversification. Currently, I’m thinking my exposure to developed markets should be around 5%. At 5%, the standard deviation of the portfolio would be 0.7329%. This is hardly higher than simply holding SPY and indicates that most of the additional risk from the higher standard deviation has been effectively diversified away. Why I use standard deviation of daily returns I don’t believe historical returns have predictive power for future returns, but I do believe historical values for standard deviations of returns relative to other ETFs have some predictive power on future risks and correlations. Yield and Taxes The distribution yield is 2.26%. The SEC 30-day yield is 2.49%. Those yields aren’t bad and make this ETF look attractive as part of a dividend portfolio. However, the ETF invests in foreign securities and I’m not a CPA or CFP. Investors concerned about tax consequences should seek advice from someone knowledgeable about their tax situation. Expense Ratio The ETF is posting .08% for an expense ratio, which is very low. Market to NAV The ETF is trading at a .45% premium to NAV currently. In my opinion, a .45% premium to NAV is a problem for new investors. I think the ETF is significantly less attractive when it trades above NAV. A .10% premium isn’t too bad in my opinion, but .45% bothers me. It’s not terrible, but I’d be cautious about that. Largest Holdings The diversification within the ETF is excellent, as shown by the following chart: (click to enlarge) I don’t love having my portfolio invested in U.S. Dollars (my checking account gives me that exposure), but I can understand the ETF needing to have some cash. With no company over 1.5%, that diversification is great. I have not performed individual research on the holdings, but with no exposure over 1.5%, I don’t think there is a viable case for returns on time in researching the individual holdings. Investing in the ETF is largely relying on modern portfolio theory. The argument for the investment is the respectably low correlation of the portfolio to the major U.S. index funds. Making an investment requires a belief that markets are at least somewhat efficient so that the companies within the portfolio will be reasonably priced. Conclusion I’m currently screening a large volume of ETFs for my own portfolio. I’ll do a little more digging on SCHF later and post what I find. The portfolio I’m building is through Schwab, so I’m able to trade SCHF with no commissions. I have a strong preference for researching ETFs that are free to trade in my account. I think SCHF will merit a fairly small position within that ETF portfolio. The low correlation and the low expense ratio are the driving factors for me. Additional disclosure: Information in this article represents the opinion of the analyst. All statements are represented as opinions, rather than facts, and should not be construed as advice to buy or sell a security. Ratings of “outperform” and “underperform” reflect the analyst’s estimation of a divergence between the market value for a security and the price that would be appropriate given the potential for risks and returns relative to other securities. The analyst does not know your particular objectives for returns or constraints upon investing. All investors are encouraged to do their own research before making any investment decision. Information is regularly obtained from Yahoo Finance, Google Finance, and SEC Database. If Yahoo, Google, or the SEC database contained faulty or old information it could be incorporated into my analysis. The analyst holds a diversified portfolio including mutual funds or index funds which may include a small long exposure to the stock.
The Rolling Stones Understand Long-Duration Investing

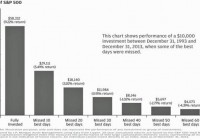
Summary Many investors have short-term horizons. Short-duration investors can miss major market gains. We think long-duration investing creates wealth over long periods of time. Time is on my side, yes it is. Time is on my side, yes it is. Now you all were saying that you want to be free But you’ll come runnin’ back, You’ll come runnin’ back, You’ll come runnin’ back to me. It’s only after the animals are out of the barn that investors want to close the door. This means attempting to make most of the money from participating in common stocks, but somehow regularly going to cash in the worst declines. Consider the aftermath of the 2007-09 financial meltdown and bear market, when asset allocators first looked to those active equity funds which weathered the 2008 storm the best. You want to make money in stocks, but you “want to be free.” So it seems that every time there is a substantial bear market in U.S. stocks, market timing pops to the center of the investing conversation. At Smead Capital Management, our 34 years of market observation has yet to find anyone or any system which did this successfully. The chart below shows why “time is on my side” for the long-duration investor: (click to enlarge) You’re searching for good times but just wait and see, You’ll come runnin’ back, You’ll come runnin’ back, You’ll come runnin’ back to me. Once market participants decide they want to be involved in a bull market, they have a tendency to seek out the most exciting growth companies of the era. Warren Buffett cautioned, “Investors should remember that excitement and expense are their enemies.” Fama-French, Bauman-Conover-Miller, David Dreman and Francis Nicholson all proved academically that the cheapest stocks outperformed the average and the most expensive stocks over one-year and multiple-year time periods. At Smead Capital Management, we strive to be long-duration investors in the shares of companies which are both quantitatively cheaper and qualitatively above average in significant ways. We expect over time that investors will “come runnin’ back” into ownership of businesses which match our eight criteria for stock selection. It takes contrarianism and patience. One of the best examples of the combination of cheapness and quality we’ve seen was four years ago in the pharmaceutical/biotech industry of the S&P 500 Index. In the key areas of profit consistency, free cash flow and balance sheet, these were stars. And they were priced as if they’d never have another new product. In case anyone wonders, the humility and contentiousness of these kinds of situations can take three to five years to play out. We were fortunate to have some other parts of our portfolio succeeding for us back then, and a loyal/patient group of long-duration investors along for the ride. Go ahead baby, go ahead, go ahead and light up the town! And baby, do anything your heart desires Remember, I’ll always be around. And I know, I know like I told you so many times before You’re gonna come back, Yeah you’re going to come back baby In the current environment, investors’ “heart desires” are to have the comfort of being in every sector and every company of the S&P 500 Index, so that they are sure to have some winning tickets in the horse race. They are “lighting up the town,” and seem able to benefit from the cost advantage inherent in indexing. For those who don’t have access to a high-margin-of-safety/long-duration investing discipline or the predilection to practice one themselves, owning numerous un-meritorious and overpriced companies mixed in with a minority of worthy ones provides a minimally adequate way to participate for the long term. How many investors send their kids off for higher education with instructions to accept way less than excellent long-term academic results from the least expensive college? We believe that “time is on the side” of the long-duration investor who applies quantitative and qualitative screening and the long-term holding of common stocks. When the S&P 500 Index stumbles, like it did after the tech bubble broke in 2000, “we’ll be around” and expect many index investors are “going to come back baby.” Remember what John Maynard Keynes said about investing, “[Investing] is the one sphere of life and activity where victory, security and success is always to the minority and never to the majority. When you find any one agreeing with you, change your mind.” Passive investing in the U.S. large-cap equity space appears to no longer be in the minority, as this year’s overwhelming money flows have proven. We are not bothered even if the current trend continues, because our long-duration goals include “victory, security and success.” The information contained in this missive represents SCM’s opinions, and should not be construed as personalized or individualized investment advice. Past performance is no guarantee of future results. Bill Smead, CIO and CEO, wrote this article. It should not be assumed that investing in any securities mentioned above will or will not be profitable. A list of all recommendations made by Smead Capital Management within the past twelve month period is available upon request.

Cybersecurity: The One ETF You Need To Know For 2015

The Sony hack and latest credit card breaches show demand for the market. The ETF’s top ten holdings are relative small companies with eight being worth less than $2 billion. The ETF is the only pure play in the sector and should see strong demand as the go to product for the market. In November, a new ETF hit the market that for the first time offered investors a way to get a basket of stocks in one of the hottest sectors. PureFunds launched the ISE Cyber Security ETF (NYSEARCA: HACK ), which remains the first and only true cybersecurity ETF for investors. With all of the talk about the Sony (NYSE: SNE ) hacking and what it means for companies, this fund is likely to come out a winner for many years as trends shift towards securing the world’s data. According to this interview , the inspiration for the fund was twofold. The company wanted to showcase the potential of the cyber security industry and also saw the lack of an investment vehicle in the sector. When asked about the non-direct competing ETFs that are in the technology sector, the company pointed something very interesting out. The larger PowerShares QQQ Trust ETF (NASDAQ: QQQ ) and Technology Select Sector SPDR ETF (NYSEARCA: XLK ) have less than 5% overlap with ISE Cyber Security. Here is a look at the top ten holdings as of December 20th: Imperva (NYSE: IMPV ): 8.4% Vasco Data (NASDAQ: VDSI ): 8.3% Infoblox (NYSE: BLOX ): 5.9% Palo Alto Networks (NYSE: PANW ): 5.8% Qualys (NASDAQ: QLYS ): 5.8% IntraLinks (NYSE: IL ): 5.1% Proofpoint (NASDAQ: PFPT ): 5.1% Radware (NASDAQ: RDWR ): 4.8% Fortinet (NASDAQ: FTNT ): 4.7% Barracuda Networks (NYSE: CUDA ): 4.7% In total, the fund has 26 holdings. Most of the top ten holdings aren’t immediately recognizable. In fact, two of the bigger names in cyber security, Symantec (NASDAQ: SYMC ) and FireEye (NASDAQ: FEYE ), make up 4.5% and 3.4% of the ETF respectively. It is worth noting that the average market capitalization of the top ten holdings is $2.55 billion. This figure comes with two of the funds trading less than $1 billion and eight of the top ten holdings having market capitalizations under $2 billion (Fortinet $5.1 billion, Palo Alto Networks $10.1 billion). I think this represents a huge opportunity as these companies can grow fast in this market and offer sizable returns. Cybersecurity is a huge market and is continuing to grow. The Sony hack that left the paper using pen and paper has shown how vulnerable companies are and also what the cleanup process can look like. The FBI also said that 90% of companies are vulnerable and could have been attacked just like Sony was. Sony recently hired Mandiant Forensics, a unit of FireEye to help with the cleanup. Mandiant is an incident response firm that helps victims of breaches by cleaning up and restoring. Mandiant has helped with some of the biggest security breaches, including the infamous 2013 Target (NYSE: TGT ) hack. FireEye makes up 3.4% of the ETF, but shows exactly what kind of growth the industry is seeing. Staples (NASDAQ: SPLS ) recently estimated that 1.16 million customers may have been impacted by a credit card hack at its stores. This follows up a two-year period that has seen Home Depot (NYSE: HD ), Target, Kmart, Dairy Queen, and JPMorgan (NYSE: JPM ) in the news for security breaches. As the publicity spreads on these issues and also the claims filed by victims, companies are forced to upgrade security and pay the companies in this portfolio. Investing in a cybersecurity ETF means you win as companies protect themselves. More hacks may make the investments worth more, but investors should rest assured that these companies don’t need hacks to survive, but rather companies to use their prevention software and intelligence to combat potential attacks. One situation investors and companies should be watching is the Regin Trojan that Symantec brought to the public’s attention recently. The top tier espionage tool is being used against governments, infrastructure, businesses, researchers, and individuals. Since 2008, Regin has been using a “degree of technical competence rarely seen.” These are scary times for cybersecurity as data continues to seem unsafe and readily accessible by those who want to find it. The ETF has an expense ratio of 0.75%. The fund has $66 million in assets currently, but I expect that to grow as more information and publicity comes out for this one of a kind ETF. Average volume is 153,000 shares a day. As we head into 2015, I have to recommend investors take a good hard look at this ETF. Despite trading at its highest point since its short inception, I believe the fund has much more to offer. This is a red hot sector that is going to see billions of dollars incoming from large and small companies alike. The company has a good basket of stocks and with lower market capitalization stocks up top, may grow faster than investors are expecting.