Tag Archives: alternative

‘The Turn’ Is Near For Natural Gas Pricing, Buy UGAZ
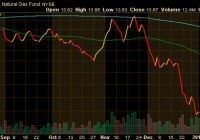
Summary UGAZ is about to bottom on Thursday despite a few poor inventories to follow. I lay the factors that will help lead natural gas pricing higher. Although plenty of volatility will follow, get long UGAZ and ride the longer term trend higher. “The Turn” for natural gas pricing, as I like to call it, should be taking place beginning with capitulation trading on next Thursday’s natural gas inventory report which should be a bloodbath for natural gas longs, of which I am as of a few days ago. 2014 was murderer’s row for natural gas bulls as natural gas couldn’t find a cold winter or anything resembling a winter outside of the occasional cold snap. Hilariously, for those like myself short the entire way down, that would cause an unwarranted and ill-advised #NotablePop (twitter hashtag searchable) buying of natural gas trading vehicles like The United States Natural Gas ETF, LP (NYSEARCA: UNG ) and even more hilariously the VelocityShares 3x Long Natural Gas ETN (NYSEARCA: UGAZ ). Take a look at these execution charts: (click to enlarge) (click to enlarge) (click to enlarge) Keep in mind that during the winter of 2013 UGAZ reached the high $40s. The ETN now trades in the $2s. I sold it to somebody at $45 (highlighted in the white box above), which frankly I still feel bad for the buyer. The good news is, I’ve switched hats from black to white and I’m now long a starter position of UGAZ at $2.90 with plenty of beaten and bloodied 2014 natural gas bull money to spend on lower buys. That can mean only one thing, natural gas pricing has bottomed and is about to go much higher. What’s my natural gas pricing increase thesis based around?: Falling rig counts hurt overall production – that’s good for the supply side of the equation as production is slowed overall. Less oil E&P to come on lower CAPEX across the board for oil and natural gas E&Ps – that’s also good for the supply side of the equation (Source: Bloomberg.com). I’m betting on the fact that spring will start early and Summer will be, well, it’ll be hot – that’s good for the demand side of the equation – for clarity these projections are based on longer term weather models from Weather.com which may be unreliable. I believe at poor hedging or at lower than ideal aggregate hedging that natural gas E&P names won’t “pump baby pump” as hard into what has been excellent hedging in size the last few years – that’s also good for the supply side. Examples of companies I’ve reviewed that have 1) less than ideal pricing hedging or 2) less than ideal aggregate hedging coverage are Chesapeake Energy Corporation (NYSE: CHK ) , Antero Resources Corporation (NYSE: AR ) , Ultra Petroleum Corp. (NYSE: UPL ) , H alcon Resources Corporation (NYSE: HK ) , SandRidge Energy, Inc. (NYSE: SD ), Quicksilver Resources Inc. (NYSE: KWK ), etc. This list could have been 50 names deep. Obviously the big variable portion of the equation above is weather. Let me do you guys a favor and make this real easy. Go ahead and pull up the city of Austin, TX into your weather app in your smart phone. Only view that city’s weather. Don’t EVER look at another city’s weather or another part of the country’s weather. Austin is the bell weather for natural gas demand. Why is that? I have no idea. Actually I think it has something to do with the fact that Austin is centrally-located, located near a major creator of weather systems – the equator, and that Texas in general is a huge user of natural gas. The fact that Austin sees the fewest of the far end of the spectrum weather developments when it comes to Texas cities makes it a great middle-spectrum city to judge Texas weather. Take a look at the following charts and consider the following: (click to enlarge) My models use a ground level temperature of 50 degrees as the demand generator for heating demand in the heating seasons and 75 degrees for cooling demand in cooling seasons. The redline in the graph on the left, which lists Austin temps the last twelve months, is indicative of this 50 degree temperature. Notice that when temps fall below the line (indicated by the blue streaking bars), UNG pricing moves higher. When it does not, UNG pricing moves lower. The correlations have been boxed in red . You can see a very high level of correlation between the two. Now, also notice that during the summer of 2014 there was in fact cooling demand (red lines on the chart to the left spiking above 80 degrees) but that demand was offset by greater than expected injections from natural gas producers (Source: U.S. Energy Information Administration) which held pricing flat through the summer and allowed for a further lack of cooling demand during the “winter” of 2014 (boxed in red toward the right hand side of each graph) to destroy natural gas pricing (also listed as a factor that will now contribute to the bull thesis as I believe from analysis of E&P sector names that hedging is not as comprehensive as it has been nor will production be as great because of the other factors bulleted). Notice that while the temperature curve remains the same from a slope line perspective the correlation falls apart in other regions – this is Chicago which stays in a much tighter temperature range: (click to enlarge) I’ve boxed Chicago temps in red below 50 degrees simply as a comparable temperature range but notice that Chicago temps stay in a 30 degree range basically year round with heating demand necessary just about 9 months out of the year. The correlation falls apart on this graph. How about New York City?: (click to enlarge) Again, we see the correlation fall apart. I have modeled in the correlation between UNG and every major city in the U.S. where demand is meaningful (based on population and the cities’ usage of natural gas) and Austin’s is the most reliable I could find. Again, with such tight temperature ranges it makes using other cities hard when trying to isolate a specific temperature at which demand is created and at which other weather systems will be effected. So, as I bid my short weapon of choice goodbye I’ll leave readers with a quick look at the chart that developed since I got long the VelocityShares 3x Inverse Natural Gas ETN (NYSEARCA: DGAZ ) at ~$2.75: (click to enlarge) If you haven’t already, I would begin accumulating a position in UGAZ on dips as I think the lowest it goes is ~$2.00 on Thursday’s smoke show. Even though several inventory reports in a row after that will be terrible, I think the big energy desks that trade this commodity will begin building positions that will start to support pricing. When you’re moving real weight, not the 100 share lots of retail, you have to do it over the course of a month or so and I think that starts in 6 days. For the record, I plan to run this column weekly or as often as I have a meaningful update to provide on inventory reports. That means you can tune in for tasty treats every Thursday. I have bought UGAZ but make no particular recommendation to any other person or entity to do so. Buying a 3X leveraged commodity trading vehicle should be done after one’s own analysis and at one’s risk. Disclosure The risks of investing in a 3X leveraged commodity trading vehicle like UGAZ/DGAZ are much greater than those of other vehicles. These risks include (Source: Velocitysharesetns.com/ugaz): ETNs are only suitable for knowledgeable investors seeking daily exposure (including inverse or leveraged exposure) to the underlying index. ETNs are intended for short-term trading, therefore investors with a horizon longer than one day trading should carefully consider whether the ETNs are appropriate for their investment portfolio. Because the inverse leveraged ETNs and leveraged long ETNs are linked to the daily performance of the applicable underlying Index and include either inverse and/or leveraged exposure, changes in the market price of the underlying futures will have a greater likelihood of causing such ETNs to be worth zero than if such ETNs were not linked to the inverse or leveraged return of the applicable underlying Index. The ETNs do not guarantee any return of principal at maturity and do not pay any interest during their term. At higher levels of volatility, and since the ETNs are not principal protected, there is a significant chance of a complete loss of ETN value even if the performance of the index is flat. The closing indicative value on each valuation date is determined in part by reference to the daily percentage change in the level of the underlying index. As a result, to the extent the closing indicative value of the ETNs is greater than or less than the initial indicative value, subsequent changes in the level of the index may have a bigger or smaller impact on the closing indicative value of the ETNs than if the closing indicative value remained constant at the initial indicative value. For example, assuming an initial indicative value of $100, if the closing indicative value of the ETNs increases above $100, a subsequent 1% daily change in the level of the index will result in more than a $1 decrease in the closing indicative value of the ETNs. Likewise, if the closing indicative value of the ETNs is less than $100, a 1% increase in the level of the index will result in less than a $1 increase in the closing indicative value of the ETNs. If the level of the underlying index decreases or does not increase sufficiently (or if it increases or does not decrease sufficiently in the case of the inverse ETNs), to offset the effect of the Daily Investor Fee over the term of the ETNs, the investor will receive less than the principal amount of his investment upon early redemption, acceleration or maturity of the Notes. This particular ETN also runs the risk of being decayed by contango which is defined by Investopedia as: A situation where the future price of a commodity is above the expected future spot price. Contango refers to a situation where the future spot price is below the current price, and people are willing to pay more for a commodity at some point in the future than the actual expected price of the commodity. This may be due to people’s desire to pay a premium to have the commodity in the future rather than paying the costs of storage and carry costs of buying the commodity today. Finally, there are general risks that should also be considered such as liquidity risk (Source: Investopedia.com): The risk stemming from the lack of marketability of an investment that cannot be bought or sold quickly enough to prevent or minimize a loss. Liquidity risk is typically reflected in unusually wide bid-ask spreads or large price movements (especially to the downside – which are magnified in leveraged ETNs) . The rule of thumb is that the smaller the size of the security or its issuer, the larger the liquidity risk. Disclosure: The author is long UGAZ. (More…) The author wrote this article themselves, and it expresses their own opinions. The author is not receiving compensation for it (other than from Seeking Alpha). The author has no business relationship with any company whose stock is mentioned in this article.
TransCanada: What’s Next After The Looming Presidential Veto Of Keystone XL Pipeline?

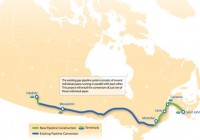
Summary TransCanada’s Keystone XL has received a majority “yes” vote from Senate, but it will likely get vetoed by President Obama. There are several things the company can do, including asking for remedies under the North American Free Trade Agreement. Further delays, however, will not jeopardize TransCanada’s future as the company has bigger and better projects in its capital program. Last week, the Democrats blocked the passage of TransCanada’s (NYSE: TRP ) Keystone XL pipeline bill in the U.S. Senate, lingering on the house’s discussion over the construction of the project. On Thursday, however, the Republicans — who have favored the pipeline — successfully passed a slightly amended version of the bill with 62 “yes” votes, thanks to the support from nine Democrats. But the bill is still five votes short of 67 required to bypass a presidential veto. The White House has already said that the President is going to use his authority to stop the bill from becoming a law on the pretext of the completion of the ongoing U.S. government review. The proposed 1,179-mile pipeline will carry 830,000 barrels of heavy oil a day from Canada’s tar sands to Nebraska’s Steele City, where it would connect with existing pipelines headed for refineries at the U.S. Gulf Coast. The pipeline will be built with a price tag of C$8 billion and could lift TransCanada’s annual EBITDA by US$1 billion when fully operational. The bill will likely get vetoed by President Obama, but that won’t be the end of Keystone XL. The fact that the project got the green light from the U.S. Senate for the first time since it was proposed in 2008, and a favorable ruling from Nebraska’s Supreme Court earlier this year, could be a harbinger of more positive things to come. It also helps that Keystone XL supporting Republicans now control both houses of Congress. Following the veto, the Republicans can modify the bill and resubmit for another round of debate. The legislative act with two-thirds majority will override the need for a presidential permit. Additionally, TransCanada could opt to seek remedies under the North American Free Trade Agreement (NAFTA), arguing that the rejection of the project is in violation of this historic agreement. The energy chapter of the free-trade agreement stipulates uninterrupted flow of oil, except under exceptional circumstances. Although it is debatable whether such an action would be a desirable for TransCanada, I believe it could certainly have an impact on the senators’ and President Obama’s decision. Alternatively, to avoid all the controversy surrounding the construction of a border-crossing pipeline and eliminate the requirement of a presidential permit — while also giving Canadian oil producers access to the U.S. Gulf Coast — TransCanada could construct a rail loop that would link up U.S. and Canadian crude pipelines. The company has already said that it is mulling the establishment of a rail terminal in Hardisty, Alberta — where the Keystone XL pipelines would have begun — and an import terminal in Cushing, Okla., which is the heart of the U.S. oil storage capacity with access to all the major markets. That said, TransCanada’s future prospects aren’t wrecked by the political wrangling over Keystone. That’s because over the years, Keystone has become less relevant to the company. In fact, Keystone XL is neither the largest nor the most profitable project in TransCanada’s C$46 billion backlog of capital programs. The C$12 billion Energy East pipeline is currently the biggest project in the company’s backlog. The Energy East pipeline would carry as much as 1.1 million barrels of crude oil a day from Alberta to shipping terminals located in eastern Canada, while lifting the company’s annual EBITDA by C$1.7 billion. Analysts believe Energy East could offer better margins than Keystone XL. (click to enlarge) Energy East Pipeline Map, Project Website . Besides the major pipelines, TransCanada also has C$13.2 billion of small- to medium-scale projects, which will gradually come online over the next three years. These projects, the company’s CEO Russ Girling said during the third-quarter conference call, will “provide visible benefits” to the company’s shareholders and will increase EBITDA. Furthermore, TransCanada has also diversified into power generation and gets around one-fifth of its earnings from this business. The company owns around 11,800MW of power generation capacity, serving customers in Alberta, Ontario, Quebec, and the northeastern United States. TransCanada’s 2,480MW Ravenswood Generating Station in Queens, N.Y., is its biggest plant and can handle around 21% of N.Y. City’s peak load. Meanwhile, due to the delays, the Canadian oil sands producers that would have been the biggest beneficiaries of the Keystone XL pipeline — such as Canadian Natural Resources (NYSE: CNQ ) , Suncor Energy (NYSE: SU ) and Cenovus Energy (NYSE: CVE ) — have been using other sources to ship their crude. Consequently, according to latest data from the National Energy Board of Canada, crude oil exports via rail have climbed 11.6% sequentially and 47.1% year over year to 182,059 barrels a day in the third quarter of 2014. Bottom Line The Nebraska Supreme Court ruling on Keystone XL removed a key hurdle in the construction of the project and the recent Senate approval is another step in the right direction. The bill will likely get vetoed by President Obama, but TransCanada will still have several options on the table. Ultimately, despite delays, I believe the pipeline will be built. That said, TransCanada has several other projects in its pipeline that are bigger, better, and less controversial than Keystone XL. TransCanada’s shares have fallen by 10% over the last six months, settling at $44.48 when the markets closed on Friday. The company’s shares are reasonably priced at 23.5 times its trailing 12 months earnings. The shares have been largely priced between 21 and 26 times over the last three years. Disclosure: The author has no positions in any stocks mentioned, and no plans to initiate any positions within the next 72 hours. (More…) Business relationship disclosure: This article was written by Sarfaraz A. Khan, with valuable contributions from Adnan Mushtaq, research assistant at Half Bridge Business Review. Neither Sarfaraz A. Khan nor Adnan Mushtaq have any positions in the stock(s) mentioned in this article. The article expresses the author’s own opinions and does not constitute investment advice. The author is not receiving compensation for it (other than from Seeking Alpha). The author has no business relationship with any company whose stock is mentioned in this article.

Why I’m Buying Gilead And Selling Celgene

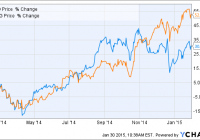
Summary Gilead appears very cheap compared to Celgene. In this article I compare growth expectations to valuation for the two companies. I think that a “pair trade” long Gilead and short Celgene makes sense at this time. Today I am starting a new mock portfolio on Seeking Alpha: the Pairs Trade Portfolio. Every transaction made in the portfolio will be a pair of trades of equal value (as close to $20,000 for each stock as can be), one long trade and one short trade. I plan on adding to this portfolio – and readjusting as necessary – over the next months and years and it will probably end up being a rather large study. The first trade is to go long Gilead (NASDAQ: GILD ) and short Celgene (NASDAQ: CELG ). My apologies for the length and description of this article. As it is the first in the series I will define and describe the strategy of pairs trading in detail here and refer to this page in future articles. Those readers familiar with the concept can skip over the next part and begin reading at the “Gilead vs. Celgene” section below. What is a “pair trade” and why would an investor want to do it? Pairs trading takes two highly correlated investment instruments and essentially pits them against each other. What stock will do better, Lowe’s or Home Depot? Pfizer or Merck? The investor goes long on the stock he/she thinks is undervalued relative to the overvalued one. The (relatively) overvalued one gets shorted. The investor is thus hedging bets and isolating a trade that only takes into account the relative value between two stocks. The strategy is often thought of as a very technical, statistics-driven exercise in which an outperforming stock is always shorted and the underperforming one is always the long. “Reversion to the mean” is counted on to make money in the pair trade. However, I feel that approach is short-sighted and I won’t be a slave to it. There are countless examples of stocks that outperform others consistently despite a high degree of correlation in the short term. Those are cases in which a pair trade with the underperforming stock as the long should be avoided. The motivation for making a pair trade is largely due to the fact that the strategy is a market-neutral hedge. It does not matter if the overall market crashes or zooms to new heights; the investor makes money if and only if the long stock pick outperforms the short stock pick. For example, let’s assume we set up a pair trade that is long Gilead at $100 per share and short Celgene at $120 per share and a market crash hits us in 2014. At the end of 2014, Gilead sits at $60 per share and Celgene goes to $60 as well. If the original position was $20,000 in each stock, then our pair trading investor has made $2,000 during 2014 (long GILD loses $8,000, short CELG gains $10,000) – a gain of 5% overall. Pairs trading is potentially a great defensive strategy. The market-neutral aspect of it makes it something to consider when it appears that stocks are overvalued in general. Pairs trading protects the investor from high valuations. Here’s a simplistic example: an investor believes that company A is a great company in a great industry. He/she really wants to invest in company A but the market is in the stratosphere and A sports a P/E of 70 – the risk seems to outweigh the reward. But he/she sees that company B, which has similar prospects to company A has a P/E of 110. The investor can go ahead and invest in company A as a pair trade with B and those P/E ratios might as well be 7 and 11, or 700 and 1100 for that matter. Recently I hear a lot of statements like “there’s nothing to buy”, “money has to be invested somewhere”, or “I’m afraid of valuations, but I don’t know what else to do but buy and hold.” At this point in time, I feel that every investor should consider any and every conservative strategy available. In my opinion, the US markets are in for a correction and I have written about the macro outlook a couple of times recently: One could think of a pairs trade strategy as another “what to do” when a bear market looks likely. Gilead vs. Celgene Both Gilead and Celgene are large biotech companies (market caps of about $157 billion and $96 billion respectively) and therefore it is not surprising that the correlation between the stock prices of the two companies was high during the past year: GILD data by YCharts A major divergence occurred recently – in early November – when Gilead started drifting lower/sideways while Celgene powered higher. On December 22, GILD took a fairly large plunge when Express Scripts (NASDAQ: ESRX ) announced that it would exclusively cover the AbbVie (NYSE: ABBV ) hep C drug. The question is, does that divergence mean that Gilead is undervalued compared to Celgene? The above chart suggests that might be the case and a further look is in order. I think that GILD is a better buy than CELG and the next sections will cover the growth prospects and valuation comparisons. Growth for Gilead The average analyst estimate for sales growth in 2015 is 17.8%. A quick look at where that growth will come from is in order to see if it makes sense. Estimates for worldwide growth in Sovaldi/Harvoni sales in 2015 are all over the map and while it is certainly difficult to guess where that will land, I’d say a conservative estimate is for 5% growth in sales. I’ve seen estimates from -5% to 30% growth. Sovaldi/Harvoni will likely account for more than half of Gilead’s total sales in 2015, but other drugs are growing fast and becoming more important for the company. In a previous article about Gilead, I noted that: According to Thomson Reuters, sales of idelalisib [Zydelig] are forecast to exceed $1 billion by 2017, with consensus sales forecasts of $1.218 billion that year. Zydelig began sales last quarter and it will be interesting to see how well it did in Q4 2014. It should add somewhere between $500 million to $700 million in 2015. In my article referenced above, I also singled out Stribild and noted that it was expected to see sales of over $2 billion in 2016. In 2014, it should easily clear the $1 billion mark. Like Zydelig, Stribild should also add a considerable amount to the top line. My estimate is an additional $700 to $900 million in 2015 sales. Complera/Eviplera is another in Gilead’s best-in-class HIV stable of drugs that is growing fast. In the first nine months of 2014, sales grew over 60% year to year and will eclipse the $1 billion mark for all of 2014. I expect it to add $500 to $600 million in sales to 2015 figures. A look at Gilead’s most recent 10-Q (see part 13. Segment Information) shows that the other drugs will likely be slightly up or slightly down. Add in any new approvals and there should be slight growth in the “other” category of those products that I did not mention above. Adding everything up (and making some assumptions for Q4 2014) puts my rather conservative 2015 revenue growth at about 12% – 14%. So by my back-of-the-envelope reckoning, the analyst expectations for 17.8% revenue growth look reasonable to me. Growth for Celgene Celgene’s growth is much easier to estimate as the company just gave guidance yesterday. Management expects 2015 revenue to grow 22.3% over 2014. Analyst estimates show a number of 21%, so it looks safe to assume something in the low 20s. Valuation I have recently written about Celgene’s GAAP and non-GAAP reporting in an article titled ” Celgene: Could You Be More Like Gilead, Please? ” and because I believe that the non-GAAP numbers inflate EPS, I will use GAAP figures for the P/E calculations below. Gilead should report EPS of about $7.25 for 2014. At a current stock price of $104.80, that equates to a P/E of 14.5. Celgene has reported EPS of $2.39 for 2014. At a current stock price of $119.16, that equates to a P/E of 49.9. Let’s take a look at cash generation: GILD Cash from Operations (TTM) data by YCharts Gilead’s market cap is about 60% higher than Celgene. However, it generates more than 300% cash than Celgene. The above chart shows the trailing 12 months, so once Gilead’s Q4 results are put into it, the figure will likely be something like 400% more cash from operations. Finally, a look at revenue: GILD Revenue (TTM) data by YCharts Again, Gilead’s soon-to-be-released Q4 results are not included. Once they are, the TTM sales number should be around $23 billion, or 200% higher than Celgene. Conclusion When we look at sales, earnings, and cash flow, we can see that Gilead is at a level anywhere from two to four times higher than Celgene. And yet the market cap of Gilead is only 60% higher than Celgene. 2015 growth estimates favor Celgene by 22.3% to 17.8%. Gilead’s incredible growth in 2014 will plateau and we will see good – but not exceptional – growth in 2015. For that reason, Celgene clearly does deserve a higher multiple, but not a multiple that is more than three times that of Gilead. I expect to see the difference in multiples between the two stocks narrow, thus favoring GILD in a pair trade. The Portfolio So here is what the mock portfolio looks like so far after executing the first pair trade: (click to enlarge) Not terribly exciting yet, but there will be more to come. Be sure to click “follow” if you would like to get real-time alerts on my future articles. Disclosure: The author is long GILD. (More…) The author wrote this article themselves, and it expresses their own opinions. The author is not receiving compensation for it (other than from Seeking Alpha). The author has no business relationship with any company whose stock is mentioned in this article.