Tag Archives: alternative

Why Should You Buy EQT Corporation?
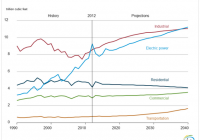
Summary EQT’s strong and well-diversified asset base will successfully support its ability to cater to the growing market. Moreover, the company plans to drill about 181 wells this year, which will further expand its production capacity. EQT’s leading cost structure and financial flexibility further aid its future growth. Based in Pittsburgh, Penn., EQT Corporation (NYSE: EQT ) is one of the largest natural gas producers in the Appalachian Basin and has been reporting healthy financial results for over a decade. Its improving financial performance year over year is indicative of the company’s strong business model. In my opinion, the company enjoys a strong competitive position in the market because of factors that not only support its future profitability, but also make it a worthy investment in the long term. Let’s analyze a few of these factors. Strong Asset Base Supports Its Ability to Successfully Cater to the Growing Market According to the U.S. Energy Information Administration (EIA), the demand for natural gas is expected to sharply rise in the coming years. Consumption is expected to increase from 25.6 trillion cubic feet (Tcf) in 2012 to about 31.6 Tcf in 2040, reflecting a compounded annual growth rate of nearly 0.7%. Except for residential, the use of natural gas is expected to rise in every end-use sector. The demand for gas in the residential sector has declined as a result of many U.S. citizens moving to warmer areas of the country. Source: EIA . I believe EQT can successfully accommodate the growing demand for natural gas as it owns a diversified and strong asset base. The company has been a major player in the Appalachian Basin for more than 120 years and seems to be taking full benefit of the Marcellus play, which is one of the most productive natural gas plays in North America. EQT owns about 3.6 million gross acres, which includes nearly 580,000 gross acres in the Marcellus play. It has total reserves of about 36.4 trillion cubic feet equivalent (Tcfe) of which half (18.5 Tcfe) are located in the Marcellus play, which has registered an annual growth rate of about 32% during the past few years. The company has over 14,500 gross productive wells, and has been witnessing a strong growth in its natural gas and oil reserves over the past few years. The total proved reserves grew from only 4,068 billion cubic feet equivalent (Bcfe) in 2009 to about 8,348 Bcfe in 2013. That reflects an annual increase of about 15%. Source: Investor Presentation . Moreover, the company plans to drill about 181 wells this year, which will further expand its production capacity — thus strengthening its ability to successfully cater to the growing market. Industry Leading Cost Structure and Financial Flexibility Accelerate Future Earnings EQT has an attractive cost structure that would definitely help it generate attractive profits, compared to those in its peer group. The company incurs nearly $0.88 per Mcfe of finding and development costs compared to the industry average of $2.74 Mcfe. The operating expenses per unit of $0.52 incurred by EQT is also much lower than the industry average of $1.68. Source: Investor Presentation . Furthermore, the company has ample liquidity to successfully execute its business plan. The total cash and cash equivalents and restricted cash increased from $845 million at the beginning of 2014 to nearly $1,355 million at the end of the third quarter of 2014, reflecting an attractive rise of about 60%. The company’s current net debt to total capital ratio is 21% and looks quite reasonable. Moreover, except for $166 million of debt maturing this year, no major debts/liabilities are payable earlier than 2018. The manageable debt maturities have raised EQT’s ability to appropriately finance future drilling operations and important projects, thus increasing its profitability. Source: Investor Presentation . A Risk to Consider Natural gas is a commodity and therefore the company receives market-based pricing. The market for natural gas is quite volatile and any fluctuation in its price can significantly affect EQT’s future revenues and profits. The current market scenario does not seem to favor EQT as natural gas prices continue to fall. During December 2014, the U.S. natural gas price declined below $3 per million British thermal units for the first time since 2012. The rapidly rising production of natural gas along with comparatively stable demand will put downward pressure on its price. According to some estimates, increasing natural gas production will leave inventories at a level of more than 4 trillion cubic feet by the end of October 2015. Analysts have lowered their estimates for average natural gas price in 2015 from $3.75 per million Btu to $3.60. Although EQT exercised a few hedging activities to protect its cash flows from exposure to the risk of changing commodity prices, it still cannot fully immunize itself from the any fluctuation in natural gas market. The company utilizes several derivatives commodity instruments, including NYMEX swaps, collars and futures where it enters into fixed price natural gas sales agreements. However, these agreements involve contracts that fix only the NYMEX portion of the price and contracts that fix the NYMEX and basis. In this way, the full price still cannot be hedged, thus putting the company’s future profitability at risk. Conclusion The sum and substance of my analysis is that EQT is well-positioned to cater to the growing natural gas market. EQT’s diversified and strong asset base and industry-leading cost structure give it an edge over its industry peers. Moreover, EQT’s financial flexibility further supports the successful execution of its business plan. Based on my analysis, I give the stock a buy rating. Disclosure: The author has no positions in any stocks mentioned, and no plans to initiate any positions within the next 72 hours. (More…) The author wrote this article themselves, and it expresses their own opinions. The author is not receiving compensation for it (other than from Seeking Alpha). The author has no business relationship with any company whose stock is mentioned in this article.
When The Dollar Crashes

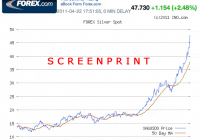
Editor’s note: Originally published on January 26, 2015 Back in late April of 2011, legendary investor Jim Rogers made one brilliant call combined with one incredibly stupid observation. So he was hitting about 50%. That’s not bad, the very best prognosticators rarely do better than getting it right 65% of the time. Most people get it dead wrong most of the time. Speaking of silver on April 20, 2011, Rogers was quoted as saying, “If silver continues to go up like it has been over the past 2 or 3 weeks, yes, then it would get to triple digits this year. And then we’ll have to worry. It’s not parabolic yet”. Rogers concluded silver wasn’t yet in a bubble. That may well turn out to be one of the very worst predictions Jim Rogers ever made in his life. A week later, on April 28, silver peaked at just a smidgen under $50. In two weeks, by May 12th, silver dropped by an incredible 33%. But Rogers got one thing dead right when on April 20th, he said, “A parabolic move and all parabolic moves end badly.” Silver went parabolic and Rogers couldn’t look at a chart and recognize a parabolic move when it stared him in the face. He knew enough to understand the effect of a parabolic move; he just didn’t see it in front of him. If you want to retire rich, go to a tattoo parlor and have them inscribe on your forehead, in reverse writing, “ALL PARABOLIC MOVES END BADLY.” In the same way that people tend to think in absolutes about politics, either you are a Republican or a Democrat; investors want to think in terms of either Technical Analysis or fundamentals. That tends to suggest there are no other alternatives in either politics or investing. I don’t know a single investor made rich by either TA or fundamentals. Maybe they work for some, some of the time. I’ve just never seen it. In April of 2011 silver went parabolic. At least to those who were capable of recognizing a parabolic chart in front of them. There were probably 100 fundamental reasons to buy silver. TA suggested silver was headed to the moon. Both were wrong. There are 100 reasons to buy a commodity, any commodity, at every top. And if you actually believe TA is valid, invert the chart and see what is suggests then. That’s what Warren Buffett did before rejecting TA as an investment guide. The investment psychology as measured by the bullish consensus toward silver in April of 2011 was higher than it was at the very top of silver at $50.25 in late January of 1980. And silver went parabolic. ALL PARABOLIC MOVES END BADLY. I was working on a piece for Friday, last week, and I needed to know what the Dollar Index was doing. I pulled up a chart and saw that the Dollar Index was up a remarkable 2% for the day . It actually went above 2% during the day but I couldn’t capture it on a screen print. I did capture the 2% move and used it in a piece. 2% in a day is a lot in any currency much less the Dollar Index. For one reason or another, I watched again on Friday to see what the Dollar Index would do. Between Thursday and the high on Friday the 23rd of January the Dollar Index climbed a remarkable 3.25% in 36 hours. I’ve never seen such a move in a currency. No one that I know saw that or at least no one remarked on the move. So I went back to the piece I wrote about silver on April 25th of 2011 and looked at the chart I had posted of silver where I claimed, “Silver is going parabolic.” I took a lot of flak at the time in 2011 because all the silver clowns were convinced silver was going to $500 an ounce overnight. I was right, they were wrong. Silver went parabolic and then crashed in two weeks by 33%. About five guys got it dead right in April of 2011 and everyone hated them for it. A 3.25% move in any currency is a parabolic move. It is the kind of move that ends a trend, no matter up or down. There are a hundred fundamental reasons to buy the dollar right now. TA suggests the Dollar Index is going to 125. Everyone loves the dollar. The bullish consensus on the Dollar Index is the highest in recorded history. That is what marks tops. ALL PARABOLIC MOVES END BADLY. Black Swan events are those hard to predict and rare events that are beyond the realm of normal expectations. Parabolic moves may not qualify as in the realm of normal expectation but that doesn’t mean you can’t recognize them in front of your nose. The dollar index will crash one day. It won’t be down 33% in two weeks similar to that move in 2011 in silver. But the Dollar Index could be down 1/3 of the move since July of 2014 in as little as two weeks. The index was around 80 on July 1st and rocketed higher to 95 last week. I can see the dollar dropping 5 points in two weeks. Wouldn’t everyone be shocked?

Between The U.S. Economic Recovery And Global Slowdown There Is GLD

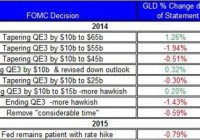
Summary The FOMC is still likely to raise rates in the coming months, but the global economic slowdown could still keep up GLD. I reexamine the relation between GLD and the U.S. dollar. The upcoming non-farm payroll report could bring GLD further down. The FOMC’s recent meeting was concluded with no changes to policy. The statement presented modest changes to the wording. For now, the market still estimates a rate hike in the middle of year. Following this news, the price of the SPDR Gold Trust (NYSEARCA: GLD ) fell down albeit it’s still up for the year. Let’s review the latest from the FOMC, the upcoming reports to be released this week, and reexamine the relation between the U.S. dollar and gold in light of the global economic slowdown. Last week’s main event was the FOMC meeting , in which the FOMC tried not to “rock the boat” and provided little changes in the wording in the statement. Nonetheless, following the release of the FOMC statement, the price of GLD took another tumble. (click to enlarge) Source of data taken from FOMC’s site and Bloomberg The statement still suggested that FOMC remains bullish on the U.S. economy, which isn’t a good sign for keeping rates low for a long time. The recent release of the U.S. GDP , in which the GDP growth rate for the fourth quarter was only 2.6%, market expectations were at 3% and in the third quarter the GDP grew by 5% may have contributed to the rally of GLD on Friday. A closer look at this report, however, reveals a more complex picture: real personal consumption grew by 4.3%; conversely, government spending tumbled down by 7.5%; private inventories added 0.8 percentage points to the growth rate. So even though government spending dropped, the GDP grew by 2.6% – mostly due to higher personal consumption and gain in inventories. All in all, this wasn’t a bad result and could tie up the FOMC’s bullish sentiment with respect to the progress of the U.S. economy. The upcoming non-farm payroll report could provide another indication for the progress of the U.S. labor market. Current estimates are for a gain of 231,000 jobs in January. A much higher gain in number of jobs could result in another fall in the price of GLD. (click to enlarge) Source of data taken from the U.S. Bureau of Labor Statistics and Google Finance Moreover, if the labor market keeps showing signs of recovery over the coming months, then this will bring the FOMC one step closer towards hitting the rate hike button. The debate over the next rate hike is likely to pick up in the coming months as we will get closer to the June meeting. Some still suspect the FOMC could back down from its current direction of raising rates in the coming months. But the FOMC doesn’t tend to make such a deviation from its direction unless the economic climate when it comes to inflation and labor warrants such a change. On both counts, the FOMC continues to voice little concern and to change market expectations with a sudden announcement, while has been done in the past, seems less likely considering the conditions only continue -albeit slowly – to improve. Despite the recent fall in the price of GLD, gold holdings in GLD keep picking up, and as of last week, reached over 758 tonnes of gold – this is a 6.5% gain since the end of 2014. This is also the highest level of gold hoards for the ETF since October 2014. This means, the recent fall in the price of GLD didn’t hold back investors from investing in the ETF. Another point to consider is the ongoing rise in the U.S. dollar, which coincides with the rally of gold prices. The chart below shows the relation between the U.S. dollar and gold prices during 2014-2015. Source of chart taken from FRED The relation between the U.S. dollar and GLD should be, as expected, negative; i.e. when the U.S. dollar appreciates against major currencies, the price of GLD tends to come down. This wasn’t the case, however, in recent weeks, as indicated in the chart above. Since the beginning of the year, both GLD and the U.S. dollar appreciated. But this type of positive relation was also the case back in 2008. (click to enlarge) Source of chart taken from FRED Back then, the U.S. economy, as well as other leading economies, was in a recession. This time, however, the U.S. economy is performing well while other economies show a slowdown in growth. In both times, the demand for gold picked up when the economic climate was uncertain and the global economy wasn’t doing so well. In times of uncertainty, the U.S. dollar tends to rise, U.S. treasury yields fall and gold prices rise. The main difference is that the U.S. economy, this time, is doing much better, and thus the U.S. dollar is likely to keep appreciating. Therefore, the ongoing appreciation of the U.S. dollar is likely to eventually catch up with the price of GLD and curb down its rally. For now, it seems that even if the FOMC were to raise rates in June by 0.25%, it won’t bring down the ongoing fall in the U.S. treasury yields and, consequently, the recovery of GLD. After all, the concerns over the global economy continue to offset the impact of the potential rise in the Fed’s rate on gold. In times of uncertainty, the U.S. dollar and GLD rally. But it also means that the recent rally of GLD could slow down on account of a stronger U.S. dollar. For more see: 3 Questions About Gold Disclosure: The author has no positions in any stocks mentioned, and no plans to initiate any positions within the next 72 hours. (More…) The author wrote this article themselves, and it expresses their own opinions. The author is not receiving compensation for it (other than from Seeking Alpha). The author has no business relationship with any company whose stock is mentioned in this article.