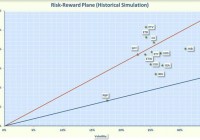
Summary Covered call CEFs provided an average income of about 8.5% with risks only slightly greater than the S&P 500. In general, during the recent strong bull market, most covered call CEFs lagged the S&P 500 on a risk-adjusted basis. Since 2007, covered call CEFs have consistently outperformed the covered call ETF (PBP) on a risk-adjusted basis. As an income-focused investor, I’m a fan of covered call Closed End Funds (CEFs) and have written several articles on Seeking Alpha discussing their risks and rewards. For this article, I reviewed my previous analyses and selected ten of best-performing CEFs that delivered good returns at a reasonable risk (as measured by volatility). However, before I launch into the results of the analysis, I will provide a quick tutorial for the investors that may not be familiar with covered calls. The basic idea of investing in covered calls is simple. An investor will buy a stock and write (that is sell) a call option against their stock position. Since the investor owns the stock, the position is termed “covered.” The call option will give the buyer the right (but not the obligation) to purchase the stock at an agreed upon price (called the strike price) any time before the expiration date of the option. For this right, the call buyer pays a premium to the writer (the investor who sells the option). If the price of the stock increases above the strike price before the expiration date, then the option buyer may “call away” the stock from the writer, that is, the writer is forced to sell the stock at the strike price. If the price of the stock does not increase above the strike price, then the option expires worthless and the writer can pocket the premium. Thus, covered calls are a way to receive additional income but in return, the writer sacrifices some of the upside potential of the stocks. In a strong bull market, you would expect the covered call strategy to under-perform the S&P 500 because many of the best performing stocks will be “called away.” But during a correction, the premiums provide a buffer to limit losses so, theoretically, writing covered calls should decrease volatility. This is not always true since volatility is dependent on the specific strategy implemented by the writer. Although simple in principle, actually implementing a profitable covered call strategy is not that easy. The investor must not only select a suitable stock but must also select the option to write and when to close or rollover positions. My favorite way to add covered calls to my portfolio is via CEFs because they are actively managed and provide excellent distributions. However, as with most CEFs, you may experience higher volatility due to the active management coupled with the fact that CEFs may sell at a premium or discount to Net Asset Value (NAV). The covered call CEF investors should also understand some of the unique aspects associated with Return of Capital (ROC). Return of capital has a bad connotation because it is usually associated with a fund literally returning part of the capital you invested. This would be bad and result in a decrease in NAV. However, the exact definition of ROC depends on complex accounting and tax rules. For example, if a fund receives a premium from writing a call, this premium cannot be booked as income until the option either expires or is closed out. In addition, in a bull market, the fund manager may decide to not sell stocks that have greatly appreciated but instead use income that he has accumulated on his balance sheet to pay the distribution. In both these cases, part of the distribution may be labeled as ROC but it is not destructive. My rule of thumb is that ROC is not destructive as long as the NAV continues to increase. Another important metric for CEF investors is the Undistributed Net Investment Income (UNII). As the name implies, this is the amount of income that has not yet been distributed. A positive UNII means that he funds has some reserves that can be used for distributions in the future. On the other hand, a negative UNII indicates that the fund has dipped into reserves to make up for a short fall in income. A small positive or negative UNII is usually not very significant. However, if the UNII is negative and is large relative to the distributions, this could be a red flag that the distributions may not be sustainable in the future. The ten CEFs that I selected are summarized below. I apologize in advance if I did not include your favorite covered call funds. However, I welcome comments from readers on funds that have performed well. It should also be noted that some of my favorite covered call CEFs, like Nuveen’s Enhanced Premium and Income (DPO) were recently merged with other funds so were not included in the analysis. BlackRock Enhanced Equity Dividend (NYSE: BDJ ). This CEF sells for a 10.5% discount, which is slightly smaller than its 3-year average discount of 11.2%. The portfolio consists of 94 holdings, invested primarily in large cap equities from the United States. The stock selection criteria is focused on equities that pay dividends. Options are written on about 50% of the portfolio. In 2008, the price of the fund dropped about 17%. This fund does not utilize leverage and has an expense ratio of 0.9%. The fund has a distribution rate of 6.9%, paid primarily from income and ROC. The ROC appears to be non-destructive since the NAV has increased over the past year and the UNII is small. BlackRock Enhanced Capital and Income (NYSE: CII ) . This is the oldest covered call CEF with an inception date of 2004. It currently sells at a discount of 7.6%, which is a smaller discount than the 3-year average discount of 8.5%. This fund is relatively concentrated, with only 75 holdings that are primarily (83%) U.S companies. The fund managers have a flexible mandate and can invest in all size companies but most are medium to large cap. The price of this fund dropped 36% in 2008. The fund typically writes options on about 50% of the portfolio. The fund does not use leverage and has an expense ratio of 0.9%. The distribution is 8.2% with a significant portion of the distribution coming from ROC but the ROC appears to be non-destructive since the NAV has increased over the past year and the UNII is small. Eaton Vance Enhanced Equity Income (NYSE: EOI ). This fund sells at a 7.2% discount, which is smaller than the 3-year average discount of 10.2%. This fund contains 42 large cap holdings, all from the United States and writes options on about 50% of the portfolio. The price of this fund lost about 26% in 2008. The fund does not use leverage and has an expense ratio of 1.1%. The distribution is currently 7.5% funded primarily from short term gains and ROC. The ROC appears to be non-destructive since the NAV has increased over the past year. However, the UNII is negative and relatively large with respect to the distribution size, creating some concern on the sustainability of the distribution. Eaton Vance Enhanced Equity Income II (NYSE: EOS ). This sister fund to EOI sells at a discount of 5.6%, which is smaller than its 3-year average discount of 9%. The fund has 88 large and mid-cap holdings, all from the United States. The fund writes options on 50% of the portfolio, does not use leverage, and has an expense ratio of 1.1%. The fund lost about 32% in 2008. The distribution is currently 7.6% funded primarily from long and short term gains with some ROC. The ROC appears to be non-destructive since the NAV has increased over the past year. However, as with EOI, the UNII is negative and relatively large with respect to the distribution size, creating some concern on the sustainability of the distribution. This fund is highly correlated (90%) with EOI. Eaton Vance Tax-Managed Buy-Write Income (NYSE: ETB ). This CEF sells for a discount of 2.3%, which is smaller than the 3-year average discount of 5.7%. The portfolio consists of 183 holdings, with 100% domiciled in the United States. The fund writes calls on almost all of the assets. The price of this fund only dropped 19% in 2008. The name “tax-managed” means that the fund managers try to minimize the tax burden by periodically selling stocks that have incurred losses and replacing them with similar holdings. This strategy has the effect of reducing or delaying taxable gains. The fund does not use leverage and has an expense ratio of 1.1%. The distribution is 8.2%, funded primarily from ROC. The ROC appears to be non-destructive over the past year but the UNII is large compared to the distribution, which is a concern. Eaton Vance Tax-Managed Buy-Write Opportunities (NYSE: ETV ). This CEF sells at a discount of 3.2%, which is smaller than the 3-year average discount of 6.3%. This is a large fund with 208 holdings, all from the United States. About 60% of the holdings are from S&P 500 stocks and the other 40% are from NASDAQ stocks. The fund writes options on about 85% of the portfolio. The price of this fund dropped 30% in 2008. The fund does not use leverage and has an expense ratio of 1.1%. The current distribution is 9.1% funded primarily by non-destructive ROC. The ROC appears to be non-destructive over the past year but the UNII is large compared to the distribution, which is a red flag. Eaton Vance Tax-Managed Global Buy-Write Opportunities (NYSE: ETW ) . This CEF sells at a discount of 4.8%, which is less than the 3-year average discount of 9.2%. This is a large fund with 457 holdings, with 55% from U.S. firms. After the United States, the largest holdings are from Europe. The fund utilizes index options that cover most of the value of the portfolio. The price of this fund dropped 33% in 2008. The fund does not use leverage and the expense ratio is 1.1%. The distribution is 9.9% paid primarily from ROC. Over the past year, some of the ROC may have been destructive as evidenced by the decrease in NAV and relatively large UNII. Eaton Vance Tax-Managed Dividend Equity Income (NYSE: ETY ). This CEF sells for an 8.3%% discount, which is slightly smaller than the 3-year average discount of 10.3%. The fund has 65 holdings, all from the United States. The fund typically writes options on the S&P 500 index rather than individual stocks. The price of this fund dropped 25% in 2008. The fund does not use leverage and has an expense ratio of 1.1%. The distribution is 8.9%, paid primarily from income and ROC. The ROC appears to be non-destructive over the past year but the UNII is relatively large compared to the distribution, which is a concern. Voya Global Advantage and Premium Opportunity (NYSE: IGA ). This CEF sells at a discount of 8.4%, which larger than the 3-year average discount of 6.9%. The fund has 110 holdings, with 60% from the U.S. and the rest from Europe and Asia. The fund hedges currency risks and sells options on 50% to 100% of the portfolio value. The price of this fund dropped 35% in 2008. It does not use leverage and has an expense ratio of 1%. This distribution is 9.7%, funded primarily from ROC. Some of the ROC may have been destructive over the last year since the NAV decreased. However, the UNII is positive, which is a good sign. Cohen & Steers Global Income Builder (NYSE: INB ). This CEF sells at a small discount of 0.5%, which is smaller than the 3-year average discount of 5%. The portfolio has 227 holdings, with 90% in equity and 11% in other income focused securities such as preferred stock. About 55% of the holdings are domiciled in the United States with the rest diversified globally among many different countries. This is one of the few covered call CEFs that use leverage (currently about 19% leverage). The expense ratio is 1.8% and the distribution is 9.5%, paid primarily with ROC. Over the past year some of the ROC may have been destructive as evidenced by the decrease in NAV and the relatively large negative UNII. For reference I also included the following funds in the analysis: SPDR S&P 500 (NYSEARCA: SPY ). This ETF tracks the S&P 500 index and has an ultra-low expense ratio of 0.09%. It yields 1.8%. SPY will be used to compare covered call funds to the broad stock market. PowerShares S&P 500 BuyWrite (NYSEARCA: PBP ). This is the only ETF that is liquid and has a history that goes back to 2007. It tracks the CBOE S&P 500 BuyWrite Index, which measures the return received by buying the 500 stocks in the S&P Index and selling a succession of one-month, near-the-money S&P 500 index call options. The fund has an expense ratio of .75% and yields 5.1%. This ETF was launched in December of 2007 so its data does not quite span the entire bear-bull cycle. Assuming equal weight, a portfolio of these CEFs averages 8.5%, which satisfies my desire for high income. But total return and risk are as important to me as income so I plotted the annualized rate of return in excess of the risk free rate (called Excess Mu in the charts) versus the volatility for each of the component funds. I used a look-back period from October 12, 2007 (the market high before the bear market collapse) to 5 February, 2015. The Smartfolio 3 program was used to generate the plot shown in Figure 1. Note that this plot is based on price and not on the NAV of the funds. NAV is a valuable metric for some analyzes but for risk and return I prefer price since it is the metric that determines actual profits and losses. (click to enlarge) Figure 1. Risk versus reward over bear-bull cycle Figure 1 illustrates that the covered call CEFs have had a large range of returns and volatilities over the bear-bull cycle. To better assess the relative performance of these funds, I calculated the Sharpe Ratio. The Sharpe Ratio is a metric, developed by Nobel laureate William Sharpe that measures risk-adjusted performance. It is calculated as the ratio of the excess return over the volatility. This reward-to-risk ratio (assuming that risk is measured by volatility) is a good way to compare peers to assess if higher returns are due to superior investment performance or from taking additional risk. In Figure 1, I plotted a red line that represents the Sharpe Ratio associated with SPY. If an asset is above the line, it has a higher Sharpe Ratio than SPY. Conversely, if an asset is below the line, the reward-to-risk is worse than SPY. Similarly, the blue line represents the Sharpe Ratio of PBP. Some interesting observations are evident from the figure. The passively managed PBP had a volatility much less than the S&P 500. However, the PBP return was also small resulting in a risk-adjusted performance that was worse than any of the CEFs. Covered call CEFs are a volatile asset class, with volatilities slightly greater than the S&P 500. This might surprise some since covered calls are touted to reduce volatility. However, this is the nature of CEFs. As amply illustrated by the plot, the actively managed covered call CEFs are substantially more volatile than the passive covered call ETF. On a risk-adjusted basis, only a few covered call CEFs (ETV, ETB, and CII) was able to outperform the S&P500 on a risk-adjusted basis. Most of the CEFs had risk-adjusted performance that was greater than PBP but less than SPY. Of the CEFs, the worst performance was booked by BDJ. The most volatile CEF was INB, likely due to the global exposure of this fund. I next wanted to assess the degree of diversification you might receive from purchasing multiple covered call funds. To be “diversified,” you want to choose assets such that when some assets are down, others are up. In mathematical terms, you want to select assets that are uncorrelated (or at least not highly correlated) with each other. I calculated the pair-wise correlations associated with the covered call funds. I also included SPY to assess the correlation of the funds with the S&P 500. The data is presented in Figure 2. (click to enlarge) Figure 2. Correlations over the bear-bull cycle The figure illustrates what is called a correlation matrix. The symbols for the covered call CEFs are listed in the first column on the left side of the figure along with SPY and PBP. The symbols are also listed along the first row at the top. The number in the intersection of the row and column is the correlation between the two assets. For example, if you follow EOS to the right for two columns you will see that the intersection with CII is 0.770. This indicates that, over the bear-bull period, EOS and CII were 77% correlated. Note that all assets are 100% correlated with themselves so the diagonal of the matrix are all ones. The last two row of the matrix allows us to assess the correlations of the CEFs with PMB and SPY. There are several observations from the correlation matrix. Many of the covered call CEFs are relatively highly correlated (greater than 80%) with SPY. Thus if you have an equity portfolio that mimics the S&P 500, then you may want to purchase the covered call CEFs that are the least correlated with SPY If your portfolio is more esoteric and does not reflect the S&P 500, you are free to select any the covered call funds. Generally, it is OK to purchase more than one of the CEFs if they are not highly correlated with each other. However, it pays to check the pair-wise correlation before you make a final decision. For example, you would not want to purchase both EOS and EOI since these two CEFs are almost 90% correlated. Somewhat surprising, the covered calls CEFs are only moderately correlated with PBP. In fact, the CEFs are more correlated with SPY than they are with PBP. My next step was to assess this portfolio over a shorter timeframe when the S&P 500 was in a strong bull market. I chose a look-back period of 3 years, from February 2012 to the present. The data is shown in Figure 3. The S&P 500 was in a rip roaring bull market over this timeframe and the covered call CEFs had a tough time keeping pace. However, both EOI and EOS were able to book the same risk-adjusted performance as SPY. The leaders over the bear-bull cycle (ETV, ETV, and CII) also performed well but fell short of the SPY performance. All the CEFs were able to outperform PBP on risk-adjusted basis. (click to enlarge) Figure 3. Risks versus rewards over past 3 years As a final test, I used the last 12 months as a look-back period and the results are shown in Figure 4. Over this period, the risks versus reward were similar to the 3 year period except that none of the CEFs were able to match SPY. The data is tightly bunched between the PBP and SPY lines. The best performers were EOS, EOI, and CII. The Voya fund, IGA, lagged during this period. (click to enlarge) Figure 4. Risks versus rewards over past 12 months Bottom Line Over all the time periods of the analysis, covered call CEFs have outperformed their ETF cousin on a risk-adjusted basis but have not been able to consistently beat the S&P 500. This is not surprising given the strong bull market since 2009. Covered call CEFs have offered good distributions but return of capital and the negative UNII associated with many of these funds is a concern. I am a fan of covered call CEFs and believe they have a place in income-oriented retirement portfolios, but they are not for the faint hearted. Also, discounts have been narrowing so my tendency is to wait for better bargains before making new investments. However, no one knows what the future will hold, so investors looking for enhanced income should give these funds serious consideration. Disclosure: The author is long ETW, INB. (More…) The author wrote this article themselves, and it expresses their own opinions. The author is not receiving compensation for it (other than from Seeking Alpha). The author has no business relationship with any company whose stock is mentioned in this article.