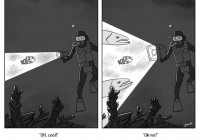
Metaphors have a powerful impact on shaping our thoughts and on what information we consider important. The machine metaphor is often used in describing economies and markets and as such, often depicts them in an unfairly positive light. For a number of different reasons, the ecology metaphor is more useful and appropriate for long term investors. By paying attention to the metaphors used, curious investors can gain a great deal of insight about the related content. One of the more interesting and unsettling experiences I’ve had was scuba diving at night. This combined an activity (scuba diving) for which I had only a beginner’s skill with an environment (pure darkness) that was challenging. The most unnerving aspect of the experience was only being able to see what was in the narrow cone of light from my flashlight; I had no peripheral vision in the darkness. While there were plenty of interesting things to see ahead of me, I also wanted to avoid damaging the coral inadvertently and I definitely wanted to avoid anything potentially dangerous. This example serves as a good illustration of how metaphors fundamentally shape our view of the world. “Metaphors govern the way we think about issues,” according to Gary Klein in Sources of Power. Klein elaborates, “It [metaphor] structures our thinking. It conditions our sympathies and emotional reactions … It governs the evidence we consider salient and the outcomes we elect to pursue.” Much like a flashlight in dark water avails us only a very limited view, so too do our mental models and associated metaphors only shine light on relatively narrow expanses of reality. Given the power of metaphor to “structure our thinking” and “govern the evidence we consider salient,” it behooves us to scrutinize the metaphors we embrace in order to think about the right things and evaluate the right evidence. Do the metaphors cast wide beams of light or narrow ones? When do they cast light on important matters and when do the leave important considerations in the dark? Because it is so commonly applied to the economy and markets, the metaphor of machine is particularly interesting to investigate. Unfortunately, the machine metaphor breaks down (sorry!) in a number of situations and this has very significant implications for investing and risk management. We find evidence of the machine metaphor throughout business and investment communications. A company may be “grinding through” some challenges or an economy may be “running smoothly” or “running like clockwork.” In addition, the concept of momentum (which also stems from the physical sciences) is frequently used to characterize economies and markets. We find evidence in statements like, “the economy is humming along” or “the economy has strong momentum.” When we examine such statements carefully, however, we can gain insights into the breadth and direction of the “light beam” of the metaphor. For example, when I think of something as having momentum, I think of a semi tractor trailer flying down a mountain highway. The relevant principles behind momentum in this case come from the physical sciences. The constant and universal force of gravity exerts its pull on the truck. Since momentum is conserved (i.e., it persists until affected by an outside force), an outside force is required to change it. From this perspective, there is little about the notion of momentum that accurately describes what happens in an economy. For one, economic growth is not a “constant and universal force” like gravity is. It depends on a lot of things all of which change over time. Secondly, economic “momentum” is not conserved. An economy can, and frequently does, speed up or slow down largely due to factors within the economic system and not due exclusively to external factors. As a result, the simple use of the word “momentum” invokes a metaphor (physical sciences, loosely machines) that shapes how we think about the economy and in most cases in an unduly positive light. While the machine metaphor is often used in regards to economic output, so too is it applied to economic risks. For example, the Fed has talked of raising interest rates in order to “keep the economy from overheating,” just as one would apply brakes in a car to slow it down. In addition, The Fed has communicated goals of increasing rates when unemployment reaches a certain level, which invokes the image of a thermostat turning off the heat when a room hits the desired temperature. In both cases, the economy has proven far more dynamic and unpredictable than the Fed’s machine metaphor would suggest. Even with these inadequacies, however, the machine metaphor often performs well enough in periods of stability. The real problems arise over longer periods of time when stability is not a good baseline assumption. What is normal is that over time, significant disruptions occur and these events often violate the assumptions under which machines normally operate. In the physical world, extreme events such as earthquakes and tsunamis are well known disruptive events. In the economy, events such as geopolitical crises and rapid credit tightening are similarly disruptive. One of the most important qualities to understand about such disruptive events is that they aren’t predictable. As John Lewis Gaddis notes in The Landscape of History , “Poincare had been right; some things are predictable and some are not.” These types of events are not predictable namely because of complexity. While we can understand some of the preconditions for such events, there are just too many variables all interacting with one another. As Nassim Taleb noted in his book, Antifragile , “With complex systems, interdependencies are severe – you need to think in terms of ecology.” This insight goes a long way in explaining the biggest weakness of the machine metaphor: When disruptive events happen, the assumptions of smooth machine operation are often violated. An electric motor can run well in a dry environment, with normal temperatures, safe from disturbances, and with a reliable power source. However, if any one of these requirements change, the motor is likely to not run nearly as well or to not run at all. Taleb’s insight also goes a long way towards identifying a more robust metaphor, that of ecology. Gaddis corroborates this finding when observing that, “Historians have a web-like sense of reality, in that we see everything as connected in some way to everything else.” In this way, historians are especially well placed to piece together multiple variables often connected in surprising ways. In suggesting that, “History is arguably the best method of enlarging experience,” Gaddis is also effectively endorsing the ecology metaphor as the biggest flashlight with the widest beam. How can investors make use of this? First, investors can use metaphors to “enlarge their experience” and thus prepare their minds in the process. Think of the nuclear incident at Fukushima. The emergency power generators kept the cooling pumps working beautifully – right up until they were flooded by the tsunami. Normal operating conditions were violated. In a similar vein, investors can invoke the ecology metaphor to inquire as to how the environment might change and as to what wild things can happen or have happened that can cause serious problems? Among such possibilities, the massively interconnected and highly leveraged international finance system could certainly freeze up again. Inflation is not a problem now, but certainly could be an issue before the end of a long investment horizon. Fiscal deficits and high debt burdens also suggest a future of higher taxes. None of this is to say these things will absolutely happen. It is to say, however, that they are distinctly possible and if they do happen, normal operating conditions for conventional investment strategies are likely to be violated with significantly negative consequences for investors. This is essentially the same thing as developing situational awareness and is analogous to developing a tornado watch methodology. Second, investors can make sure to align their investment horizon with the most compatible metaphor(s). If one has a very long investment horizon, then one should manage his/her portfolio to withstand all of the crazy things that can happen over a very long period of time. As a guide, Taleb observes that “Nature likes to overinsure itself.” He even goes so far as to say that, “The secret of life is antifragility.” As a result, long term investors should focus first on avoiding devastating losses because the problem with fragility is that it “has a ratchetlike property – irreversability of damage.” By this logic, avoiding large exposures to assets that can plummet in value in certain situations and using insurance when it’s cheap make sense. Importantly, long term investors should remain firmly focused on the long term and the big picture. In other words, don’t manage relative performance day to day, quarter to quarter, or even over three year periods. They just aren’t long enough to provide useful perspective. As a reminder, the Fed last raised rates over eight and a half years ago, the ten year Treasury bonds currently yield under two percent (a threshold it never breached during the entirety of the Great Depression) and the Fed has increased its balance sheet over $3.5 trillion (over $30,000 per US household) since the beginning of 2008. Individually and collectively these conditions are not even remotely normal in the broader context of financial history and therefore provide an exceptionally poor basis of expectations for long term investors. In short, things are likely to change and quite possibly change dramatically over a long investment horizon. An avoidable mistake is to assume you can just plod along and indefinitely defer preparations for a very different future. Third, it’s useful to consider the fact that since metaphor is such a powerful force in shaping our view of the world, people often use it as a tool to mold our perceptions. Government officials, media talking heads, business leaders, and even investment managers may have incentives to tell a story or to persuade more than to inform. The pernicious consequence for investors as that people so motivated don’t even need to risk giving bad information; they can simply employ inappropriate metaphors. In fact, this may very well be the reason why we hear momentum used so frequently in describing economies and markets – because the metaphor itself creates an unduly positive perception. The main antidote to this reality is to scrutinize metaphors as being part of the message. On this note, twice in two days this week I’ve heard the suggestion of the S&P 500 hitting 3,000. I find this especially interesting because it seems to employ a gambling metaphor. Long term investors should be interested in valuations, fundamentals, risks, and tradeoffs. Specific targets for the S&P 500 aren’t really relevant to their process. More specifically, there is absolutely no reason why anyone should use record highs as the standard for long term investing. Alternatively, hitting 3,000 does sound like hitting the lottery and therefore suggests a gambling metaphor. Insofar as this is the case, long term investors can recognize such messages as being directed to a different group of people and as one devoid of salient information for them. By the same token, some discussions obviously employ the ecology metaphor which is more appropriate for long term investors. Gene Frieda, of Moore Europe Capital Management, provided a good example in a recent piece in the Financial Times . In writing that, “The roots of the recent return of financial market volatility are not in fundamental factors, but rather reflect the Tower of Pisa-like financial architecture that has grown in the wake of the global financial crisis,” Frieda is explicitly describing the fragile (Tower of Pisa-like) nature of the financial system and its relevance as an important environmental factor affecting volatility. In observing that, “Renewed volatility is forcing market participants to recognize just how much the structure of financial markets has changed since 2008,” he is recognizing how the nature of financial markets has evolved due to the interactions of participants with each other and with a different environment. Finally, Frieda notes that, “The cut in market liquidity creates an illusion of underlying strength to market rallies when some of the strength is a function of worsening market depth. To the extent investors and policy makers judge the strength of fundamentals by the behavior of asset markets, this has created a false sense of security – about the robustness of the US recovery and eurozone resilience to new shocks.” In doing so, he is clearly accounting for the possibility of disruption. In conclusion, it is difficult enough to get one’s arms around the investment environment when overwhelmed with massive amounts of information and distracted by countless cross-currents. As such, metaphor can be a useful and practical tool in distilling overwhelming detail into digestible nuggets of insight. But metaphors also have important limitations — which curious investors can use to their advantage. For one, investors can calibrate communications by the metaphors used to achieve a deeper understanding of the message. Further, investors can, and should, be selective in focusing on metaphors that align best with their investment philosophy and goals and importantly, to avoid those that are not well aligned. (click to enlarge) Disclosure: The author has no positions in any stocks mentioned, and no plans to initiate any positions within the next 72 hours. (More…) The author wrote this article themselves, and it expresses their own opinions. The author is not receiving compensation for it. The author has no business relationship with any company whose stock is mentioned in this article.