Tag Archives: alternative

Buy Russia: Now A Bargain At Just About 6 Times Earnings
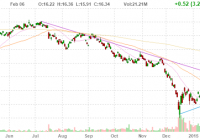
Russian stocks are very cheap at just over 6 times earnings and should be appealing for bargain hunters and contrarians. Weak oil prices have hurt Russia’s economy, but oil may have bottomed out and could rise in the future. The issue with Ukraine remains a wild card, but it appears that all parties have too much to lose and that means a resolution could be likely. The plunge in oil prices and the increasingly stiff sanctions over Russia’s foray into Ukraine have taken a big toll on the economy and the stock market. The negative headlines are likely to continue for awhile when it comes to Ukraine, but as far as the price of oil goes, things seem to be looking up thanks to a recent rebound. I am wary about investing in Russia because the geopolitical risks are significant and there are also currency and other risks. However, when valuations get to very cheap levels, it is hard to resist buying a bargain. Because of the numerous ongoing risks, I can’t allow myself to invest heavily in Russian stocks, but the cheap valuation makes me want to buy small position in the Market Vectors Russia ETF (NYSEARCA: RSX ). Let’s take a closer look: (click to enlarge) As the chart above shows, this ETF was trading for about $26 per share in July 2014, but has since plunged into the low teens. However, it is worth noting that since December, there has been a solid rally as indicated by the light blue uptrend line. Over the last few weeks, oil also appears to have bottomed out and if so, this is a major positive for Russia’s economy. Even so, that leaves the risk of war and sanctions. The sanctions have certainly started to impact the Russian economy, and it could not really come at a worse time because of the plunge in oil prices. If oil prices were still around $80 to $100 per barrel, I believe that Russia could afford to take a more protracted and antagonistic stance when it comes to Ukraine. The fact that oil is about 50% below the 2014 highs, makes me think that Putin will want to be a little more negotiable when it comes to finding solutions with the West that could lift sanctions. Over the last few days, Putin has been meeting with Germany’s Merkel, President Hollande of France, Ukraine’s leader, Petro Poroshenko and other leaders in order to find solutions. If these talks fail, the chance of war might increase which could cause Russian stocks to re-test recent lows. There is a lot at stake for all parties, especially for Russia and many European nations because of significant trade and because they rely on Russian natural gas. In a worst case scenario, Putin could shut off natural gas pipelines to Ukraine and Europe which would be a real blow to those economies. While those are significant risks, it seems like too much is at stake and I don’t see what any of the parties have to gain by escalating matters. On the positive side, if oil has bottomed out and if a cease fire is agreed to and sanctions are eventually lifted, Russian stocks could have significant upside. Russia is here to stay and this nearly perfect storm of weak oil prices and sanctions might be a fantastic buying opportunity. The Market Vectors Russia ETF has a price to earnings ratio of just about 6.5 times earnings. Right now, the S&P 500 Index (NYSEARCA: SPY ) trades for nearly 18 times earnings. The Market Vectors Russia ETF has significant exposure to the oil industry as well as other commodities. Below, you can see the top ten holdings : (data sourced from Yahoo Finance) Top 10 Holdings (57.78% of Total Assets) Chris DeMuth Jr. is a Seeking Alpha contributor, and I believe he is also an extremely savvy investor. He recently wrote about the opportunities in Russia and pointed out metrics which show just how cheap the Russian market is now, he states : “Concerns about Russia have driven down the price of its equity market. Russia’s total market cap is only 17% of its GDP, one of the lowest in the world. This is its historical minimum and far below its maximum of 142% during the past fifteen years. Over the past eight years, its GDP has grown by over 13% per year.” Marc Faber is a well-known investor, and he is also seeing a potential buying opportunity when it comes to Russian equities. He believes Central Banks have inflated asset prices through money printing but that “low valuations” in Russia are worth considering. His views were discussed in a Bloomberg article which stated: “Russian assets may move into some kind of a buying range,” Faber told an investor briefing in London. “They can go lower but they’re moving into a buying range.” Shares in the MSCI Russia index trade at an 80 percent discount to their U.S. counterparts based on their price-to-earnings ratio, compared with an average discount of 50 percent since 2003, Datastream data showed. Russian assets are clearly cheap, and could get cheaper. You should expect volatility to continue. Because of this it makes sense to buy only a small amount and average in over time. It also makes sense to have a long-term time frame. Ten years from now, I doubt the “Ukraine Crisis” will still be top headline news and I also doubt oil will be trading for $50 per barrel. If that is the case, a little investment in Russia could pay off big in the future. Data is sourced from Yahoo Finance. No guarantees or representations are made. Hawkinvest is not a registered investment advisor and does not provide specific investment advice. The information is for informational purposes only. You should always consult a financial advisor. Disclosure: The author is long RSX. (More…) The author wrote this article themselves, and it expresses their own opinions. The author is not receiving compensation for it (other than from Seeking Alpha). The author has no business relationship with any company whose stock is mentioned in this article.
3 ETFs To Fight Against Global Currency War

The world is heading towards a currency war as a number of countries are choosing loose monetary policies to stimulate the sagging growth and prevent deflationary pressures. This is in stark contrast to the U.S. Fed policy of tightening its stimulus program by wrapping up QE3. The diverging central bank policies have propelled the U.S. dollar to a nine-year high. While a weak currency might provide short-term economic boost to the countries engaging in currency devaluation, this might take a toll on global trade and capital flow in the long term. A Look to International Easing Action Several countries in recent months cut their interest rates or took other actions to boost growth in their economy. The first and foremost country is Japan, which unexpectedly expanded its bond buying plan to 80 trillion yen from 60-70 trillion yen per year and tripled the pace of purchasing stocks and property funds (REITs) in October. Further, the government of Japan recently approved a spending package of 3.5 trillion yen ($29.12 billion) to boost consumer spending and regional economic activity. In November, the People’s Bank of China surprised the global market with a cut in interest rate for the first time in more than two years. The central bank slashed the one-year lending rate by 40 bps to 5.6% and the deposit rate by 25 bps to 2.75%. Further, China’s central bank lowered the reserve requirement ratio by 50 bps to 19.5%, effective February 5. Other nations also followed suit this year. The Reserve Bank of India ( RBI ) cut interest rates by 25 bps to 7.75% first time in almost two years while Swiss Bank scrapped its three-year old currency cap against the euro, which was pegged at 1.20. Meanwhile, the Bank of Canada reduced interest rates by 0.25% to 0.75%, representing the first rate cut since April 2009. The Turkey central bank trimmed one-week repo rate by 50 bps to 7.75% while Peru reduced the benchmark interest rate by 25 bps to 3.25%. Egypt too lowered the deposit rates and lending rates by 50 bps to 8.75% and 9.75%, respectively. The Danish central bank cut its deposit rate thrice in two weeks to a negative 0.35% from a negative 0.20%. The European Central Bank (ECB) launched a bond-buying program, committing to pump €1.14 trillion ($1.16 trillion) into the sagging Euro zone economy over the next one and half years. It plans to buy €60 billion of government bonds, debt securities issued by European institutions and private sector bonds per month through September 2016. Singapore announced a surprise currency policy easing, wherein the Monetary Authority of Singapore reduced the slope of the appreciation of the Singapore dollar against a basket of currencies by a percentage point. The most recent move came from Reserve Bank of Australia, which lowered interest rates by 25 bps to a record low of 2.25%. This is the first rate cut in 18 months. Further, Russia slashed the one-week repo rate to 15% from 17%. With that being said, the U.S. dollar is surging and other currencies are slumping. And investors need to be cautious when looking to invest outside the U.S. This is because a strong dollar could wipe out the gains when repatriated in U.S. dollar terms, pushing the international investment into red even if the stocks perform well in the rising-dollar scenario. How to Play? With the advent of the currency hedged ETFs, it has become easy for investors to cope with this situation. This is especially true as these funds look to strip out currency exposure to a foreign economy via the use of currency forwards or other instruments that bet against the non-dollar currency while at the same time offers exposure to the stocks of the specified nation. While there are a number of ETFs targeting specific nations, we have highlighted three ETFs that provide broad international play or exposure to more than one country. Deutsche X-trackers MSCI All World ex U.S. Hedged Equity ETF (NYSEARCA: DBAW ) This fund offers exposure to the stocks in developed and emerging markets (excluding the U.S.) by tracking the MSCI ACWI ex USA U.S. Dollar Hedged Index while at the same time provides hedge against any fall in the currencies of the specified nation. In total, the fund holds a broad basket of more than 1,300 securities with none holding more than 1.46% share. However, it is skewed towards the financial sector with 26.9%, followed by consumer staples (13.2%) and consumer discretionary (11.3%) Among countries, Japan and United Kingdom take the top two spots with at least 14 share each while Switzerland, Germany and France round off the top five with single-digit exposure. The ETF has amassed $16.3 million in its asset base while trades in a light volume of 12,000 shares per day on average. Expense ratio came in at 0.40%. The fund is up 12.2% in the trailing one-year period. iShares Currency Hedged MSCI EAFE ETF (NYSEARCA: HEFA ) For a broad foreign market play without currency risks, investors could also consider HEFA which focuses on the EAFE region – Europe, Australasia, Far East – for exposure. This product follows the MSCI EAFE 100% Hedged to USD index and is basically a holding of the iShares MSCI EAFE ETF (NYSEARCA: EFA ) with currency hedged tacked on. Financials dominates the fund’s return with one-fourth share while consumer discretionary, industrials, consumer staples, and health care also get double-digit allocation. Top nations include Japan, United Kingdom and Switzerland, while France and Germany round out the top five for this well-diversified fund. The fund has AUM of $391.2 million and average daily volume of roughly 162,000 shares. It charges 39 bps in annual fees and expenses and has added 11.6% since its debut almost a year ago. Deutsche X-trackers MSCI Emerging Markets Hedged Equity ETF (NYSEARCA: DBEM ) This product tracks the MSCI EM U.S. Dollar Hedged Index, which provides exposure to the emerging equity market and hedges their currencies to the U.S. dollar. The fund holds 460 securities in its basket, which is widely spread out across each component with none holding more than 3.86% of assets. Chinese firms takes the top spot at 22.5% while South Korea, Taiwan and Brazil round off the next three spots. From a sector look, financials accounts for the largest share at 28.6% closely followed by information technology (13.8%), telecom services (11.1%) and consumer staples (10.6%). The fund has managed $103.2 million in its asset base while trades in good average daily volume of around 162,000 shares. It charges 65 bps in fees per year and has returned 10.4% over the past one year. Bottom Line The popularity for currency hedging strategies has been on the rise on a strengthening U.S. dollar and the prospect of higher interest rates in the U.S. against lower interest rates in other countries. These products are expected to perform better than the traditional funds in the coming months thanks to the global currency war.

How Rebalancing Can Help Improve Earnings Quality And Lower Multiples

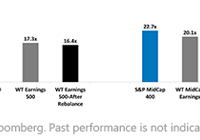
By Jeremy Schwartz A key process driving the WisdomTree earnings-weighted Index approach is a rebalancing process that refreshes constituent weights based on changes in Earnings Stream® and relative value. In earnings-weighted indexes, changes at the rebalance are made based on each stock’s relative price appreciation compared to its relative earnings growth: Companies whose stock prices increased compared to their peers’ while their earnings decreased compared to their peers’ would typically see reduced weight in the WisdomTree Earnings Indexes. In a market cap-weighted index, the only driver of weight is the relative change in market capitalization, which is usually driven by the stock price. Companies whose stock prices fell while their earnings were flat or grew would typically see increased weight in the WisdomTree Earnings Indexes. Companies that have not been profitable on a cumulative basis over the previous four quarters are removed to ensure the continued focus on earnings-generating stocks-one element that improves the quality of the basket by removing more speculative, unprofitable ventures. Weight is also shifted to the relatively more profitable companies and those that have seen highest earnings growth. One way to gauge the impact of the rebalance process is to look at the price-to-earnings (P/E) ratio, essentially the price of the Index divided by its earnings per share before and after the rebalance. Below we show the P/E multiples across market segments. As will be shown, the rebalance can have a large impact on a portfolio’s P/E ratio. U.S. Equity Index Estimated 12-Month P/E Ratios* (as of 11/30/14) (click to enlarge) For definitions of terms and indexes in the chart, visit our glossary . A Lower P/E Ratio Approach: Even prior to the 2014 rebalance, each earnings-weighted Index exhibited a lower P/E ratio than its market capitalization-weighted counterpart. After the rebalance, the P/E ratios dropped even more significantly compared to these benchmarks. This is a key benefit of the annual rebalance process that forces the discipline of reweighting to the fundamental value of the underlying constituents in the Index. Multiples Contracted Anywhere between 7% and 40% across All Indexes: The WisdomTree SmallCap Earnings Index saw multiples contract the greatest at approximately 40%. WisdomTree requires each constituent of its earnings family to demonstrate profitability. This addresses the problem seen in the Russell 2000 Index -namely, a high index-level P/E ratio that is due to index-level earnings being depressed by constituents with negative earnings-by eliminating firms that have had negative earnings over the prior 12 months. Since there are more constituents in small-cap indexes that have delivered negative earnings over the prior 12 months than there are in large-cap indexes, this effect is more pronounced within this size segment. Rebalance Track Record-Consistency in Raising Return on Equity (ROE) Now that we have studied the impact of the rebalance on lowering P/E multiples, we will show the impact of the rebalance in helping to raise the “quality” of the earnings Indexes, measured by the ROE. Post-Rebalance Raising ROE and Improving Quality (click to enlarge) For definitions of terms and indexes in the chart, visit our glossary. This chart illustrates how the rebalance has raised the ROE across four WisdomTree Earnings Indexes. In the 2014 rebalance, for example, the ROE of the WisdomTree SmallCap Earnings Index before and after the rebalance was 7.43% and 11.97%, respectively. As the bull market in equities carries on, it becomes ever more important to pay attention to the underlying valuations and market fundamentals. Above we show how the rebalance both lowered the P/E ratios of each WisdomTree Earnings Index and raised the ROE, a key metric of quality. We believe these are attractive attributes of market exposures, made even more important by the continued gains in the market we have seen in recent years. Important Risks Related to this Article Investments focusing on certain sectors and/or smaller companies increase their vulnerability to any single economic or regulatory development. Jeremy Schwartz, Director of Research As WisdomTree’s Director of Research, Jeremy Schwartz offers timely ideas and timeless wisdom on a bi-monthly basis. Prior to joining WisdomTree, Jeremy was Professor Jeremy Siegel’s head research assistant and helped with the research and writing of Stocks for the Long Run and The Future for Investors. He is also the co-author of the Financial Analysts Journal paper “What Happened to the Original Stocks in the S&P 500?” and the Wall Street Journal article “The Great American Bond Bubble.”