Tag Archives: alternative

General American Investors Company, Inc. Targeted By Activist Fund

Summary General American Investors Company, Inc. currently trades at a 13.94% discount to net asset value and has been targeted by the well-known closed end fund activist Phil Goldstein. Phil Goldstein has a long track record of fighting and winning proxy battles against closed end funds, whose boards resist initiating value enhancing liquidity events to benefit shareholders. A market neutral position, long GAM vs. short the S&P 500, offers an attractive opportunity for alpha generation based on the fund’s deep discount to NAV and involvement of activists. General American Investors Company, Inc. (NYSE: GAM ) is a diversified closed end fund that invests mostly in large-cap domestic common stocks. The fund has consistently traded at a double-digit discount to its net asset value for the past five years. The current discount is 13.94%. This past October, Special Opportunities Fund (NYSE: SPE ) submitted a shareholder proposal to General American Investors Company, Inc. requesting the Board of Directors to authorize a self-tender offer for all outstanding common shares at or close to net asset value. If more than 50% of the fund’s common shares are submitted for tender, then the tender offer should be cancelled and the fund should be liquidated or converted to an ETF or open-end mutual fund. If SPE is successful in its campaign, then shareholders stand to capture a windfall gain of as much as 14%. Special Opportunities Fund is a closed end fund run by the well-known hedge fund activist investor Phil Goldstein , co-founder of Bulldog Investors. SPE and Bulldog invest primarily in undervalued assets and engage in activism to unlock the value of their investments. SPE and Bulldog mainly target closed end funds which trade at large discounts to net asset value and pressure management to engage in value enhancing liquidity events, such as share repurchases or, in some cases, liquidation. They have had numerous successes with their activist campaigns and are not easily deterred once they set their sights on a particular target. GAM filed a preliminary proxy on February 6th, which includes the shareholder proposal submitted by SPE. The proxy also states that SPE is proposing to elect three of its own nominees as directors of the company. The Board of Directors of GAM has unanimously opposed the shareholder proposal and is recommending shareholders to vote against it. The board’s statement of opposition lists the standard multitude of reasons why they believe that the proposal is not in the best interest of shareholders. Many of the reasons are valid, but it is very difficult to argue that an event resulting in an instantaneous narrowing of the fund’s discount would not be beneficial to all shareholders. Since it is not the focus of this article, I won’t attempt to address the individual bullet points presented by the board. The list is too long to summarize, so please refer to pages 12-15 of the preliminary proxy for the details. Conclusion There are many different scenarios that can play out during this activist campaign. The most likely scenario is that the Board of Directors of GAM pursues a smaller buyback in order to placate Mr. Goldstein and avoid a proxy fight. Two of Bulldog Investors’ recent proxy fights may provide some insight into the potential expected outcomes. Firsthand Technology Value Fund (NASDAQ: SVVC ) entered into an agreement with Bulldog last May. Under the terms of the settlement , Bulldog agreed to withdraw its nominees for the fund’s Board of Directors and withdraw its proposals regarding termination of the fund’s investment management agreement. They also agreed not to present any proposals at the annual meeting and to vote their shares in accordance with the Board’s recommendations. In return, SVVC approved a plan to repurchase up to $10 million of common stock in the open market, and to conduct a self-tender offer for at least $20 million worth of common stock at 95% of net asset value. The fund also agreed to liquidate its Facebook (NASDAQ: FB ) and Twitter (NYSE: TWTR ) holdings and to distribute any net realized gains from those holdings to shareholders within 60 days of completing those liquidations. Facebook and Twitter accounted for close to 30% of the fund’s holdings at the time of the announcement. The net result for SVVC shareholders who submitted shares for tender was a return of more than 45% of their capital at close to NAV. Bulldog was also recently successful in pressuring Nuveen Investments to restructure two of its closed end funds and conduct a tender offer for 25% of the outstanding common shares at 98% of net asset value. Nuveen Global Income Opportunities Fund (MUTF: XJGGX ) and Nuveen Diversified Currency Opportunities Fund (MUTF: XJGTX ) were combined into a new fund called Nuveen Global High Income Fund (NYSE: JGH ). The net result for JGH shareholders who submitted shares for tender was a return of more than 43% of their capital at 98% of NAV. It is likely that SPE would agree to a similar proposal from GAM. Unfortunately, there is not a high probability of SPE’s proposal garnering more than 50% of shareholders’ votes due to the constituency of General American’s shareholder base. Only 30% of the outstanding shares are held by institutions and mutual funds. Small investors who own the remaining 70% of the fund tend to be apathetic when it comes to voting proxies. Let’s examine a few possible scenarios with hypothetical probabilities: Hypothetical Return Scenarios For GAM Outcome Potential Return On Shares Tendered At Current NAV Discount % Of Shares Submitted For Tender Total Return Probability Of Occurrence Probability Weighted Return Fund Liquidates Or Converts To Open-End Mutual Fund 13.94% 100% 13.94% 15% 2.09% Fund Initiates Tender Offer For 25% Of Outstanding Common Shares At 98% Of NAV 13.66% 49% 6.97% 40% 2.79% Fund Initiates Tender Offer For 10% Of Outstanding Common Shares At 98% Of NAV 13.66% 49% 2.79% 25% 0.70% Management Takes No Action And NAV Discount Remains Unchanged 0% 0% 0% 5% 0% Management Takes No Action And NAV Discount Widens To Five Year Low Of 16.4% -2.46% 0% -2.46% 15% -0.37% Expected Return 5.21% Although the above scenarios are hypothetical, they provide a framework to help assess the potential returns associated with different outcomes. They also reflect my best guess as to the final result. My opinion is that the majority of scenarios offer a favorable risk-reward profile for a market neutral position, long GAM common vs. short the S&P 500 ETF (NYSEARCA: SPY ). My recommendation is to enter into a market neutral position: long GAM and short 1.1X the dollar amount of the S&P 500. The reason for suggesting a hedge ratio greater than one to one is to account for the fact that the fund often employs leverage of approximately 16%, which magnifies returns relative to the S&P 500. The fund also held 8.5% of its assets in money markets as of year end, which will offset some of the effects of leverage. A one to one hedge ratio would not be my preference due to the aforementioned factors. The obvious risks to this trade are that GAM’s correlation to the S&P 500 breaks down and leads to an underperformance in GAM’s net asset value relative to the S&P 500. Another risk is a further widening of GAM’s discount to NAV. While these risks are by no means negligible, the broad diversification of the fund’s large-cap holdings tend to make it unlikely to diverge too much from the S&P 500. The fund’s discount to NAV has averaged approximately 14.3% for the past one, three, and five years, which is close to the current discount. The discount did, however, fall below 20% during the height of the financial crisis in 2008 and 2009. It is highly likely that the discount would widen dramatically again if another market panic sets in. Lastly, the success of this strategy hinges solely on SPE’s ability to succeed in its proxy campaign. The close of business on February 17, 2015 has been fixed as the record date for the determination of the stockholders entitled to notice of, and to vote at, the shareholder meeting. Investors who want to vote in favor of SPE’s proposal must purchase shares on or before February 10, 2015. Disclosure: The author is long GAM, SPE, SVVC, JGH. (More…) The author wrote this article themselves, and it expresses their own opinions. The author is not receiving compensation for it (other than from Seeking Alpha). The author has no business relationship with any company whose stock is mentioned in this article. Additional disclosure: I am currently long “GAM”, “SPE”, “SVVC”, and “JGH” and short “SPY”. I may initiate long or short positions in any or all of the aforementioned securities over the next 72 hours. I plan to vote in favor of SPE’s shareholder proposal and its nominees to the board of GAM.

The Impact Of Cash Flow On Asset Allocation Decisions

Guest Post: By Chris Scott Investors trying to make decisions on how to invest their savings face many complications that are frequently ignored in research papers on asset allocation. Often, it is assumed that a fixed lump sum of money is invested. But this is rarely the case in real-world investing for the individual investor. Typically, an investor will be either accumulating funds or drawing down funds, which results in regular cash flows into or out of investment accounts. These cash flows can have a significant impact on the investment results obtained, and therefore, should influence asset selection and asset allocation decisions. The objective of asset selection/asset allocation is to maximize return for a given amount of risk. When evaluating investment assets and making asset allocation decisions, asset volatility is a bad thing. Higher volatility typically means more risk. Higher volatility also reduces the geometric mean of returns (compound returns). When there are no cash flows into or out of an investment, this reduction in return from volatility drag (VD) can be estimated by: Or, to be more precise, we can calculate: VD is one of the reasons for generally trying to avoid or limit assets with high levels of volatility. However, periodic cash flow into an account changes the impact volatility can have on geometric returns. With regular contributions to an investment account, you are dollar-cost averaging into the investment. When the price of the investment increases, you purchase fewer shares. When the price of the investment decreases, you purchase more shares. To see how periodic cash flows into an account affect the geometric return of volatile investments, I ran a monte carlo simulation utilizing a normally distributed zero return investment with varying levels of volatility. Regular periodic cash flows of a fixed size were invested on a monthly basis. The size of the monthly cash flow tested ranged from 0.1% to 100% of the total initial account value. Each simulation trial was run for 60 months. After 100,000 trials for each set of parameters, the results of the trials were averaged. The graph below shows that even modest regular cash flows into an investment reduces the negative impact volatility drag can have on geometric returns. (click to enlarge) These are hypothetical results, and are NOT an indicator of future results and do NOT represent returns that any investor actually attained. Indexes are unmanaged, do not reflect management or trading fees, and one cannot invest directly in an index. Additional information regarding the construction of these results is available upon request. How do things change when using historical returns which exhibit serial auto-correlation, fat tails, and skewness? I repeated the simulation using monthly US stock market returns from 1926 to the present (returns are from the Ken French data library ). The returns were de-meaned and scaled to a desired standard deviation (average return is subtracted from each monthly return to produce a time series with an arithmetic average of zero, then multiplied by a scalar to increase/decrease the standard deviation). This results in 1000 5-year overlapping periods. The outcome shows that with actual returns, there is slightly more reduction in volatility drag compared to the monte carlo simulation. For reference, the monthly standard deviation for US stock market returns since 1926 has been 5.4%. (click to enlarge) These are hypothetical results, and are NOT an indicator of future results and do NOT represent returns that any investor actually attained. Indexes are unmanaged, do not reflect management or trading fees, and one cannot invest directly in an index. Additional information regarding the construction of these results is available upon request. So we can see that positive cash flow into an investment reduces the negative impact of volatility on returns, but that doesn’t mean an investor should blindly seek out volatility when there are significant positive cash flows into an account. Volatility hurts geometric returns. Ultimately, achieving good results is still about investing in assets with high expected returns. Typically, an investor will avoid or limit investments in high-volatility assets due to their risk. Positive cash flow into high expected return, high-volatility investments can reduce their perceived riskiness. To illustrate this, let’s consider the following assets: US cap-weighted stock market, US decile 10 momentum stocks – equal-weighted, and long-term US Treasury bonds (LTR). These three assets provide a set of risky assets with a range of returns and volatilities. Monthly Statistics LTR Mkt. Mom. Average Return 0.5% 0.9% 1.8% Standard Deviation 2.4% 5.4% 7.4% Using monthly returns from 1/1927 to 7/2014, rolling 5-year periods were simulated with varying levels of positive cash flow. (click to enlarge) These are hypothetical results, and are NOT an indicator of future results and do NOT represent returns that any investor actually attained. Indexes are unmanaged, do not reflect management or trading fees, and one cannot invest directly in an index. Additional information regarding the construction of these results is available upon request. Historically, decile 10 momentum stocks produce fantastic returns, but with high volatility and drawdowns. Consistent with the previous simulations, average geometric returns improve with fixed regular monthly investments. With their lower volatility, long-term bonds show very little improvement, while decile 10 momentum stocks add 90 basis points of return for the high-cash flow scenario. The following charts represent drawdowns in a portfolio’s value, including the added funds invested. In other words, no adjustment is made for the increasing value of cash invested. So, if an investment experiences a decline of 10%, then additional cash of 5% is added to the portfolio that month, and it is treated as a 5% drawdown. (click to enlarge) These are hypothetical results, and are NOT an indicator of future results and do NOT represent returns that any investor actually attained. Indexes are unmanaged, do not reflect management or trading fees, and one cannot invest directly in an index. Additional information regarding the construction of these results is available upon request. (click to enlarge) These are hypothetical results and are NOT an indicator of future results and do NOT represent returns that any investor actually attained. Indexes are unmanaged, do not reflect management or trading fees, and one cannot invest directly in an index. Additional information regarding the construction of these results is available upon request. (click to enlarge) These are hypothetical results, and are NOT an indicator of future results and do NOT represent returns that any investor actually attained. Indexes are unmanaged, do not reflect management or trading fees, and one cannot invest directly in an index. Additional information regarding the construction of these results is available upon request. (click to enlarge) The results are hypothetical results and are NOT an indicator of future results and do NOT represent returns that any investor actually attained. Indexes are unmanaged, do not reflect management or trading fees, and one cannot invest directly in an index. Additional information regarding the construction of these results is available upon request. With funds being invested monthly, the depth and duration of drawdowns are significantly reduced. Of course, the investment risk hasn’t changed, and the improved drawdown metrics are mostly a function of adding funds. The investment still experiences severe drawdowns in market crashes and the returns during the crash are horrible, but the pain of the drawdowns is muted by the cash flows. While it seems easy to discount this effect, it can provide an important mental benefit to the investor. The illusion of a rapid recovery in value can make the high-return/high-volatility asset seem more tolerable, enabling the investor to allocate more to risky assets, and therefore improving long-term results. It should be obvious that the 100% cash flow scenario applies to a young investor with no savings who is starting to invest. However, long-time investors who have built up substantial portfolios may wonder if any of this is useful for an investor whose cash flow into their investments is now small relative to their total portfolio value. Even in the case where an investor’s additional contributions are small relative to the entire portfolio, there still can be high positive cash flow situations. Due to government tax rules, there are significant restrictions on moving funds between different classes of accounts (IRA, Roth IRA, 401k, etc.). For example, if you change jobs, you start over with a brand new 401k account. You can rollover your 401k from your previous employer to an IRA to take advantage of the better investment options available in a brokerage IRA. The new 401k account will start with a zero balance, with no opportunity for funding other than from monthly payroll contributions. The 100% cash flow scenario would also apply to this case, providing an opportunity to allocate more to higher-risk/higher-expected return assets in the new 401k than in the other accounts. Now let’s look at what happens when there are negative cash flows. As you would expect, negative cash flow from a volatile investment further reduces geometric returns. Using monthly returns from 1/1927 to 7/2014, rolling 5-year periods were simulated with varying levels of negative cash flow. (click to enlarge) Again, long-term treasuries show little impact to geometric returns, but the momentum stocks’ geometric returns were reduced by 26 basis points at the highest withdrawal rate. So, there’s an impact from negative cash flow, but at sane withdrawal rates, the return reduction is fairly small. The impact to the drawdown metrics is more dramatic, but not always in the way you would expect. (click to enlarge) Maximum drawdowns worsen with increasing negative cash flows. These Great Depression drawdowns illustrate the extreme case of things going bad for a retiree invested in equities! (click to enlarge) Long-term treasuries suffer from their low returns, showing significant average drawdowns as the withdrawal rate increases. (click to enlarge) While the withdrawals seem to have a minimal impact on the portfolio recovery time for equities, that’s not the case. This chart only represents the recovery time where the portfolio recovered by the end of a 5-year period. On the next chart, you can see the significant increase in periods that ended without recovering from the drawdown. (click to enlarge) In the end, even with negative cash flow, it’s still about investing in assets with high expected returns. One could argue that taking withdrawals would naturally result in a declining portfolio value, which is to be expected and okay as long as you don’t run out of money, and therefore the worsened drawdown statistics with withdrawals are not relevant. However, the mental impact to a newly retired investor of a portfolio that declines and doesn’t recover year after year after year can be significant. I’ve intentionally only used individual assets rather than diversified portfolios to illustrate the impact of cash flows on risk and returns. By combining uncorrelated assets into a diversified portfolio, the overall risk/return characteristics of the investment can be improved, while all the same principles and effects associated with cash flows still apply. Ultimately, it is up to each investor to determine how much risk they can take and still sleep at night. Having an understanding of how your portfolio – and the assets in it – behave when there are positive or negative cash flows is an important aspect of getting a good night’s sleep! Original Post

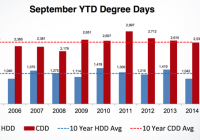
El Paso Electric – A Regional Utility Worth Considering

Summary The utilities sector declined nearly 4% on Friday amid strong hiring news. El Paso Electric is now trading at under 18X earnings, cheaper than S&P 500 and Dow Utility Index. After a hiatus beginning in the late-1980s, El Paso Electric is again making dividend payments, including its most recently announced .28/share payment, its 16th straight quarter. Largest market is El Paso in Texas, which is viewed as a pro-business positive net-migration state. Decision not to participate in the renewal of aged coal power-generating plant reflects the modernization and commitment of the Company to provide sustainable long-term energy production. El Paso Electric (NYSE: EE ) is a regional electric utility company that provides generation, transmission, and distribution service to the southwestern United States and Northern Mexico. Its 10,000 square mile service area includes parts of Texas, New Mexico, and two connections to Juarez and the Mexican national utility, Comision Federal de Electricidad. The Company’s principal industrial and large customers operate in the steel production, copper, oil refining and defense industries (including Fort Bliss Army Base and White Sands Missile Range). El Paso Electric’s net dependable generating capability of 1,852 megawatts. Key events and catalysts – A substantial portion of the Company’s fossil fuel generation facilities are over 50 years old. Over the last five years, El Paso Electric has spent nearly $1 billion dollars for the replacement of plant and equipment and for additional generation, transmission and distribution. – El Paso Electric constructed its first new plan in nearly 30 years, a 288 MW Newman 5 natural gas-fired combined cycle plant – Additional cap-ex expected to top $1.5 billion in the next five years – Due to favorable location in high desert and reduction in cost of solar panels, El Paso Electric has introduced significant utility scale solar generation at costs competitive with fossil fuel alternatives – The Company’s Montana Power Station (a $372 million local generation facility) is expected to go on-line by summer of 2015 – El Paso Electric will not participate in extending the operation of the nearly five decade old coal-fired Four Corners Power Generating Station after its scheduled retirement in July 2016. – New Mexico rate case finalization in April 2015 and Texas rate case finalization in August 2015 will seek to recapture costs related to construction, load growth and facility retirement Service Area (Source Annual Report) (click to enlarge) While the population of the state of New Mexico grew a paltry 1.3% from April 2010 – July 2013 (compared the US as a whole – 2.4% – most recent data available from Census Bureau), the state of Texas grew 5.2%, more than double the national rate. Power Generation Station Primary Fuel Type Owned Net Dependable Generating Capacity (NYSE: MW ) Ownership Interest Location Palo Verde Station Nuclear 633 15.8% Wintersburg, Arizona Newman Power Station Natural Gas 732 100% El Paso, Texas Rio Grande Power Station Natural Gas 316 100% Sunland Park, New Mexico Four Corners Station (Units 4&5) Coal 108 7% Fruitland, New Mexico Copper Power Station Natural Gas 62 100% El Paso, Texas Renewables Wind/Solar 1 100% Hudspeth/El Paso Counties, Texas Total   1,852     (Source: Most recent annual report) Notes on power generation: – The Nuclear Regulatory Commission renewed the license of all operating units at Palo Verde which now expire between 2045 – 2047. – The estimated decommissioning costs related to the Palo Verde plant is $381 million. El Paso Electric’s trust fund had a $214 million at 12/31/13. – The 50-year participation agreement among the owners of the Four Corners Station expires in July 2016. El Paso Electric has informed the other owners that it has decided to cease it participation in the plant by July 2016 opting for more economical and cost effect energy alternatives. Customer growth Growth Rate Since 2009 Total growth: 29,335, 1.5% per year Residential growth : 25,482, 1.5% per year (click to enlarge) Customer growth has been positive since 2009, but at a very modest rate in total. Earnings per share EE Net Income (NYSE: TTM ) data by YCharts While earnings per share and net income are generally positive trending over the past decade, El Paso Electric has seen drop-offs in the last several years as decommissioning and other costs have outweighed rate and customer increases. El Paso Electric’s continued profitability hinges on its ability to successfully manage delivery and production costs in a rate-regulated environment. Last Friday, positive hiring news led to declines in “safe-haven” assets including gold, bonds and utilities stocks. El Paso Electric shares fell 4.34%, consistent with sector declines. The Company now trades at 17.72x TTM earnings , which is a lower multiple than the S&P 500 (20.03x) and the Dow Jones Utility Index (19.63x). Reliance on nuclear sourced power   2013 2012 2011 2010 2009 Nuclear 46% 46% 45% 45% 45% Natural Gas 34% 32% 30% 27% 22% Coal 6% 6% 6% 6% 7% Purchased Power 14% 16% 19% 22% 26% Nuclear power makes up a substantial portion of the Company’s sourced electricity. Despite the recoverability of fuel costs for nuclear power generation, it is still expensive and can result in additional regulatory costs associated with production, waste storage and disposal. The Company current sources less than 1% of its power from solar, wind and other renewable sources, but continued investment in these alternative energy sources can help El Paso Electric to remain profitable and competitive. Weather and energy (click to enlarge) (Source: Investor Presentation) Demand for energy is in part driven by climate and weather patterns. As show above, cooling degree days (CDD) dipped below their ten year average for the first time since 2008, while heating degree days (HDD) days are down to levels not seen since 2006. Assuming global warming is real , it is not unreasonable to expect larger and more frequent temperature swings which could drive demand for electricity. Selected Ratio and financial analysis (all information from morningstar.com unless otherwise noted) Ratios and metrics   TTM 2013 2012 2011 2010 2009 Gross margin % 65.6% 67.5% 70.5% 67.5% 66.7% 64.4% Operating margin % 16.3% 18.6% 19.8% 20.8% 19.3% 16.1% Debt/equity 1.12 1.06 1.21 1.07 1.05 1.11 Book value per share 24.13 23.51 20.57 19.10 19.10 16.51 The Company’s gross and operating margins have been fairly consistent, while maintaining a health debt/equity ratio and increasing tangible book value per share. One risk facing the El Paso Electric is the continued availability of debt and equity financing for construction and other projects. Cash flow and dividends   TTM 2013 2012 2011 2010 2009 Operating cash flow 237M 247M 273M 252M 239M 269M Capital expenditures 326M 289M 269M 236M 224M 252M Free cash flow -89M -42M 4M 16M 15M 17M Dividends 1.09 1.05 .97 .66 – – Operating cash flow has been on the decline since 2012, which is not what I look to see from a utility. The Company is investing in business, growing capital expenditures each year since 2010, which hopefully will result in more attractive power generation, distribution, and delivery mechanisms. As previously mentioned, prior to 2011, El Paso Electric had not paid dividends since 1989. Since the reinstitution its dividend policy, the company has grown the total payout each year since 2011. Understanding the Mexico opportunity While El Paso Electric serves a limited geographic (southwestern United States and northern Mexico), it has a fairly diversified customer base within this region. According to El Paso Electric’s most recent annual report, no customer makes up more than 4% of non-fuel base revenues. Most of the energy distributed to the Comision Federal de Electricidad is consumed in Juarez, a city of 1.5 million. While Juarez has a reputation for crime and violence, the city represnts a solid investment opportunity for El Paso Electric as it has nearly doubled in population since 1990. Continued growth and modernization of Juarez will be a long term benefit to El Paso Electric’s bottom line. Leadership El Paso Electric announced Thursday that Chairman of the Board Michael Parks resigned to accept a job with a global investment management firm. Parks served on the board since 1996. He was replaced by long-time board member Charles Yamarone as the new chairman. Bottom line If I was looking for a moderate risk/reward small cap utility play, I would be satisfied owning El Paso Electric at current prices. It has a reasonable 2.8% forward yield , conservative 50% payout ratio, and is taking steps to move away from dirty energy and to cleaner renewable sources. There are a substantial number of utilities that offer higher yield, a longer and more consistent dividend history, and more years of profitability. El Paso Electric may be the right stock for your portfolio, but not the right stock, right now, but if you are on the fence and need a sign, put it on your watch list, and consider scaling into a position when any of the following occur: – Alternative energy as a percentage of net dependable generating capacity exceeds 10% of total. This would mean El Paso Electric has entered a new era of largely clean (natural gas and alternative) energy generation that could be a competitive advantage when the freeze-period expires and competition is introduced into EEs Texas service area. – Yield rises to 5% (but payout stays same or increases). For this to occur, El Paso Electric would need to be trading at $22.40 per share, or a dirt cheap 10.2X earnings. – All Coal and Nuclear operations are ceased and all decommissioning costs settled and final. This would remove substantial uncertainty and potential earnings volatility for intermediate horizon investors (3 – 5 years). Disclosure: The author has no positions in any stocks mentioned, and no plans to initiate any positions within the next 72 hours. (More…) The author wrote this article themselves, and it expresses their own opinions. The author is not receiving compensation for it (other than from Seeking Alpha). The author has no business relationship with any company whose stock is mentioned in this article.