Tag Archives: alternative

Are You Playing The Stock Market’s Favourite Game?

One of the most popular questions that a business channel anchor or an analyst asks a company’s management is – “What’s your EPS estimate for the next quarter and year?” For those who are not aware, EPS is the short form of ‘earnings per share’ and is calculated by dividing a company’s earnings/profits by its total number of shares. During my initial days as a stock market analyst, even I was guilty of asking similar questions about earnings, though all I wanted to hear from the managements was their long-term outlook (like for 3-5 years) and not for the next quarter or year. The truth is that the entire investment community is undeniably fixated on the EPS. All business newspapers, magazines, channels, and experts freely talk about quarterly earnings, EPS growth, and price to earnings multiples. The interesting part is that the stock market also reacts to the earnings numbers. Anyways, people’s fascination with earnings estimates is not terribly puzzling. In fact, it is perfectly rational in a market dominated by agents responsible for other people’s money but also looking out for their own interests. But what such obsession with earnings does is that it leads investors to believe that this one number strongly influences, if not totally determines, stock prices. This is despite the fact that EPS is not the most appropriate number to use for valuing a company. There are several shortcomings of earnings, like: Earnings do not show whether the company is utilizing its capital profitably or not. Earnings exclude the incremental investments that a company makes in its working capital and fixed capital that are so important to support its growth. Different companies can use different accounting principles to calculate earnings, so a comparison cannot be drawn between two companies. It is easy for companies to manipulate earnings by either inflating revenues or deflating expenses. However, notwithstanding these shortcomings of earnings, most experts love playing the earnings expectations game. The fact is that it’s just the wrong expectations game to play. A Game of ‘Winks and Nods’ It is hoped that the case for the unreliable link between short-term earnings and shareholder value is sufficient to discourage investors from participating in the popular earnings expectations game. This is simply because it is the wrong expectations game for investors who seek superior long-term returns. This is true not only because of the shortcomings of earnings but because of the way the game is played. The earnings expectations game is simply a ritual dance between management and analysts. In fact, the former chief of the US stock market regulator Securities and Exchange Commission (SEC), Arthur Levitt, called it a ‘game of winks and nods’. In Expectations Investing , the authors Michael Mauboussin and Alfred Rappaport write: Analysts have to guess how much a company will earn each quarter. But a company is allowed to provide the analysts with clues, or so-called guidance, about what it thinks earnings will be. This guidance number usually shows up as the consensus estimate among analysts. If the company’s actual earnings meet or just beat the consensus, both the company and the analysts win: the stock goes up, and everyone looks smart. The game might not sound so hard, but it requires a lot of cooperation. Companies are under enormous pressure to achieve the consensus earnings estimates while analysts rely on those same companies to help them form their earnings expectations in the first place. You might wonder how companies participate in this game. Well, companies generally have two ways to play it out. One, to manage the expectations of investors and stock market, companies guide analysts to a number that they can beat. And two, in order to beat expectations easily, they are very conservative with respect to their near-term prospects. In simple terms, a company would feed the analysts by telling them that it expects to earn Rs 100 (USD 1.61) as EPS or earnings per share in the next quarter. Analysts would take this number, do some calculation around it, and arrive at their own expectation of an EPS number that is somewhat close to Rs 100 (USD 1.61). They would then feed the market and investors on this expected EPS number, say Rs 95 (USD 1.53) per share. The market and investors would then start to believe this number. Then, when the quarter ends and the company releases its earnings report, it would say that its EPS during the quarter stood at Rs 100 (USD 1.61) per share. Remember, this was the same number the company had revealed to analysts earlier, which the analysts had chewed to spit out the Rs 95 (USD 1.53) per share number to investors. Now, since the company has announced Rs 100 (USD 1.61) EPS against the market’s ‘expectations’ of Rs 95 (USD 1.53), the analysts call it an ‘outperformance’. The ultimate result is that investors also start to take this as an outperformance and are willing to pay a higher price for the stock. The stock rises. You got the game, didn’t you? Anyways, there might be a case when this company faces a situation where investors are expecting a higher EPS (say Rs 110 or USD 1.77), and it finds it difficult to earn that much during the quarter. What it can do in such an instance is simply use some accounting tricks to achieve that magical EPS number of Rs 110 (USD 1.77), and thus ‘meet expectations’. Now the question is – how involved and interested are managements in this earnings expectations game? Well, here is a Harvard Business Review report that throws light on this… Privately, corporate chief financial officers admit that they would like to spend less time and effort satisfying Wall Street’s demands for continuous, predictable growth. But they feel they don’t have much choice, because the cost of disappointing the Street is so high. You see, the quarterly earnings management has become a sort of talisman for companies and for those who analyze them, invest in them, or audit them. However, the fact remains that this game causes more harm than amusement. When managers are focused on meeting or beating short-term earnings expectations, it distorts their decision making. A large part of the management’s attention is focused on keeping the analysts and markets happy. What is more, a lot of companies willingly borrow profits from the future to make things look good in the present (how they do this is a subject of another discussion). This entire scheme also reduces stock analysis and investing to a guessing contest. A large part of a stock analyst’s job is just to keep figuring out what the sales, or expenses, or simply profits are going to be in the next 1-2 quarters. Ultimately, it undermines the faith that most investors have on the stock market because, every quarter, they are served some fiction, and become part of the cynicism that surrounds the meeting or beating of expectations. Play it Safe! Just notice the next time companies announce their quarterly results. You will find most of them either meeting expectations or beating expectations! But, now you know how this entire game of ‘earnings expectations’ is fixed. What you can do to safeguard yourself against the fixers is to separate companies that are genuinely working towards better long-term performance from those that skillfully manage short-term expectations and earnings. And how do you do that? Just stick with companies having good businesses , safe balance sheets, and clean managements at helm. Always remember, there’s a great appeal in the word ‘earnings’. So, you have to be very very careful and not fall into the earnings expectations trap. In fact, here’s a new definition of EPS that you can start using from today. It’s Expectations Per Share …and the wrong kind of expectations!
Short Idea: International Bank Of Azerbaijan Bonds

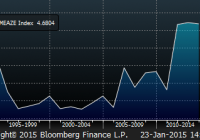
Summary Russia/Oil Derivative play with downgrade/war/financial/currency de-valuation pressure currently trading in the 90s. 93% of the economy tied to oil, 2015 budget based on $90 oil, in current conflict with Armenia, S&P outlook recently moved from stable to negative. International Bank of Azerbaijan has USD & Euro debt and local currency assets, high customer and industry concentrations and a Moscow subsidiary. (IBAZAZ is accessible via FNMIX , which is a 2.44% Holder Of IBAZAZ 5.625s Of ’19) For those who say Azerbaijan is not tied to Russia… Baku, Fineko/abc.az. The Central Bank of Azerbaijan says that US currency is in feverish demand in the country because of Russia . According to CBA, demand for US dollars increased in Azerbaijan starting from mid-December under the influence of psychological factors due to sudden depreciation of Russian currency. “To maintain stability of the national currency CBA set out $1.127 bn for sale. Before December 2014 the bank purchased $1.27 bn from the market and therefore, its net balance on currency exchange transactions was $0.143 bn last year”, – CBA says. Nevertheless, in December currency reserves of CBA reduced by $1.237 bn, which exceeded its expenses for maintaining stable rate of the national currency by $110.7 million. Azerbaijan and Oil Oil and gas production and exports are central to Azerbaijan’s economy. The country’s economy is heavily dependent on its energy exports, with more than 90% of total exports accounted for by oil and gas exports , according to data from the International Monetary Fund. Progress has so far been “elusive” for Azerbaijan in its efforts to diversify the economy away from a dependence on oil and gas, and it must press a fight against corruption to improve the business climate – International Monetary Fund Azerbaijan’s budget for 2015 is based on a price of $90 a barrel At $109 barrel oil last year Azerbaijan made significant investments in projects include the development of the Azeri-Chirag-Guneshli block of fields, Baku-Tbilisi-Ceyhan oil pipeline and the first stage of development of the Shah Deniz field. (U.S. Energy Information Administration) Azerbaijan’s main producing field, the ACG field, covers 167 square miles and is located 62 miles east of Baku in the Caspian Sea. Operators expected peak production to reach 1 million bbl/d, but production at this field so far failed to reach this target. Production problems have affected ACG output in the past couple years, with unexpected production declines occurring because of technical problems. (U.S. Energy Information Administration) But What About Azerbaijan’s Other Exports? Azerbaijan’s MP, member of the parliamentary committee on economic policy, Rufat Guliyev.: “Today, more than 70 percent of Azerbaijani non-oil products are exported to Russia, Ukraine, Kazakhstan ” But The Company (SOCAR) that Produces the Oil is Owned by the Government of Azerbaijan so They Will Support them, Right ? SOCAR only produces about 20% of the country’s oil output (U.S. Energy Information Administration) The remaining 80% of Azerbaijan’s output comes from the ACG oil fields by the BP-operated Azerbaijan International Operating Company (AIOC) and at the BP-operated Shah Deniz field (which produces oil condensate) AIOC is a consortium of 10 mostly non-Azerbaijani oil companies. (U.S. Energy Information Administration) Azerbaijan – Armenian Tensions = Possible War Update: January 26th: Azerbaijan violated the ceasefire about 800 times along the Line of Contact with Karabakh troops on January 24-25. Over 14,000 shots were fired towards Armenian military positions from guns of various calibers, grenade launchers and mortars, the press service of the Nagorno-Karabakh Defense Army reported. Conflict going on since 1994 Conflict became more serious in 2014 with significant casualties Ilham Aliyev – President of Azerbaijan; August 2014 via Twitter “We will restore our territorial integrity either by peaceful or military means . We are ready for both options.” “Just as we have beaten the Armenians on the political and economic fronts, we are able to defeat them on the battlefield “. Defense outlays will grow 27 percent to 3.8 billion manat ($4.8 billion), exceeding Armenia’s total budget spending of $3.2 billion, Finance Minister Samir Sharifov said in November 2014. On top of a budget already cut significantly due to huge drop in price of oil! (2015 budget based on $90 oil) Defense Spending back at peak levels – 1994 (when conflict started) Bloomberg Data What Happens if Azerbaijan un-pegs their currency to the USD? In June of 2013 the International Monetary Fund recommended Azerbaijan un-peg the Manat to the USD “Republic of Azerbaijan, Selected Issues” IMF Country Report: 13/165 The below table shows Azerbaijan is already on its way to a possible de-pegging of the Manat. (source: “Republic of Azerbaijan, Selected Issues” IMF Country Report: 13/165) THIS JUST HAPPENED IN TURKMENISTAN The Turkemenistan Manat has been rigidly pegged to the USD since 2009 at a rate of 1USD=2,85 MANAT Devalued by 18.6% in January of 2015 Kazakhstan had their currency pegged to the dollar as well…. In February of 2014 they unpegged their currency to the USD and devalued the currency by 19% Ok ok, What Does This Have to Do with The International Bank of Azerbaijan? The International Bank is being privatized and is only 50.65% owned by the government (as of 6/30/14 previously was 60.06% on 12/31/13) Considering that 90% of the country’s exports are oil & gas related it seems a bit strange that the financials list exposure to the industry as only 1.1% of total loans It is impossible to know how much of the loan portfolio is indirectly related to the industry 62% of IBA’s loan portfolio is related to Construction/RE development and Trade/Service industries IBA has a history of extending/renewing loans instead of marking them as past due/non-performing/impaired so we don’t truly know how many loans are in this category The bank has a $2.6B 6-12 month funding gap as of 6/30/14…bigger the gap bigger the risk (up from $2.3B at 12/31/13) IBA has ~$250M of foreign syndicated loans maturing in the first 4 months of 2015 (USD & EURO denominated) IBA has credit agreements with foreign banks which have ~$1.2B and ~EUR200M drawn down on them as of 6/30/2014 These term and revolving loans have various unknown financial covenants As of 6/30/14 the value of IBAs currency forward agreements were diminimus at ($1.1M) Concentration Risk 30 companies account for 42.5% of the total corporate loan portfolio Corporate loan portfolio is ~90% of total loan portfolio 20 Entities account for 93.7% of total guarantees as of 6/30/14 (guarantees total ~$1.6B as of 6/30/14) Moscow Subsidiary= International Bank of Azerbaijan-Moscow As reported in audited IFRS statements at year-end 2013, the bank’s aggregate exposure to the 23 largest customers amounted to 42% of total gross loans or 567% of its Tier 1 capital IBAM’s exposure to construction and real estate sectors stood at 189% of Tier 1 Capital at 12/31/2016 Time for the ISIS on the Cake Azerbaijani media: Embassy increases security in Baku because of ISIS threatening Only in January several articles about ISIS’s threatening to Azerbaijan appeared in international media outlets, and Baku has already taken up special measures related to the security of the leading countries and European state diplomacy, Azerbaijani information portal “Minval.az” reports, referring to the site “Axar.az.” The portal also notes that the European outlet “Another Western Dawn News” has recently published a sensational piece of news about the ISIS threat in Azerbaijan. It reported that Abdul Wahid Khudair Ahmad, the ISIL “Minister of Internal Affairs,” had called on the warriors from Azerbaijan to commence an armed struggle against the Western-backed Azerbaijani authorities. What could happen – Attack on BTC Pipeline Azerbaijan has 3 oil & gas pipelines/routes and 80% of Azerbaijan’s oil exports are done through the BTC pipeline , arguably the largest ISIS target in the country… (click to enlarge) (click to enlarge) (source: U.S. Energy information administration) Do I think it should be trading with a single digit yield in the 90s or even 80s given the above? Absolutely Not. (click to enlarge) (Source – Google Images) Disclosure: The author is short IBAZAZ. (More…) The author wrote this article themselves, and it expresses their own opinions. The author is not receiving compensation for it. The author has no business relationship with any company whose stock is mentioned in this article. Are you Bullish or Bearish on ? Bullish Bearish Neutral Results for ( ) Thanks for sharing your thoughts. Submit & View Results Skip to results » Share this article with a colleague

Dreyfus High Yield Strategies Fund: This Net Asset Value Bargain Offers A Generous 9.7% Yield

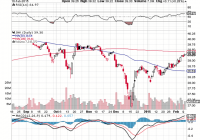
High yield bonds are rebounding and still offer generous yields. The Dreyfus High Yield Strategies Fund is trading at a significant discount to net asset value. With a yield of nearly 9.7% and a discount of nearly 6%, this closed end fund looks particularly attractive now. The Dreyfus High Yield Strategies Fund (NYSE: DHF ) is a closed end fund that invests in higher yielding bonds. As of December 31, 2014, this fund has around 221 holdings, which indicates it is well-diversified. It is also invested in a broad range of industries which includes telecommunications, consumer discretionary, healthcare, and others. This diversification helps reduce potential downside risks. Some of the top ten holdings in this fund include First Data and Sprint Nextel (NYSE: S ) bonds. Duration risk is a potential downside for bond investors, however, this fund has an average duration of just 3.93 years, which mitigates this potential risk. (click to enlarge) The SPDR Barclays High Yield Bond Fund (NYSEARCA: JNK ) is a well-known way for investors to buy high yield bonds. As the chart above shows, junk bonds experienced a decline in mid-December over concerns that some energy companies could be more likely to default due to the plunge in oil prices. Those concerns appear overblown and oil has firmed up in the past few weeks. The Dreyfus High Yield Strategies Fund has only about 10% of its portfolio in the energy sector, so I believe that with roughly 90% of it being invested in other sectors, the risks here are mitigated. While some energy companies might be more challenged, many other industries are benefiting from lower oil prices, which helps offset this potential risk. Over the past 52 weeks, this fund has traded at a premium to net asset value or “NAV,” because it offers very limited duration risk and because of the high yield. For the past year, this fund has typically traded at a nearly 1% premium to net asset value. As of February 9, the net asset value was reported at $3.82, and yet the closing share price was just about $3.60. That means this fund is trading for nearly a 6% discount to net asset value. Since this fund usually trades for about a 1% premium, that means the current discount of nearly 6% is more like getting 7% off of what investors have historically paid. The chart of historical premium/discount information below shows that it is rare for this to trade for the large discount that it has now: This fund offers a yield of about 9.7% and it pays a monthly dividend at a rate of 2.9 cents per share. For many income investors, getting paid every month (as opposed to quarterly) is attractive because it means you won’t have to wait long to get paid. This fund typically goes ex-dividend around the 7th of each month and it typically makes the payment around the 25th of each month. Here are some key points for the Dreyfus High Yield Strategies Fund: Current share price: $3.60 The 52 week range is $3.35 to $4.35 Annual dividend: 2.9 cents per month which yields about 9.7% Data is sourced from Yahoo Finance. No guarantees or representations are made. Hawkinvest is not a registered investment advisor and does not provide specific investment advice. The information is for informational purposes only. You should always consult a financial advisor. Disclosure: The author is long DHF. (More…) The author wrote this article themselves, and it expresses their own opinions. The author is not receiving compensation for it (other than from Seeking Alpha). The author has no business relationship with any company whose stock is mentioned in this article.