Tag Archives: alternative

2015 Is A Growth Year For Technology Mutual Funds

The fourth quarter 2014 earnings season is the tale of two factors; Oil prices, and global economic shifts. The decline in oil has given the consumer more disposable income, but that income has yet to be seen positively impacting other sectors as it would be expected. Further, global economic shifts have caused the dollar to be stronger against other currencies. This is having a negative impact on international conglomerates, and most other companies that have a significant international exposure. The oil situation is the main culprit for the volatility due to the fact it impacts so many other segments of the world economy. Further, the decline in oil has given a slight rise of better performances in some other sectors due to consumers having more money in their pocket, but not as much as analysts initially thought. On the other side, the strengthening dollar is cutting into profits for international companies, causing negative revisions in 2015. But there is one segment that is showing double digit growth, but has no real dependence upon oil prices, or is adversely impacted by the stronger dollar; the Technology Sector. The Technology sector earnings growth is almost twice as much as the S&P 500 for Q4, and is expected to outperform the S&P 500 over the next three quarters after that (Q4 14 +12.4 vs. 6.4% for S&P 500, Q1 15 expected growth +6.4%, S&P 500 -2.1%, Q2 15 +3.8% vs. S&P 500 at -3.0%, Q3 15 +6.8% vs. S&P 500 at +0.6%). So with growth prospects outperforming the S&P 500 through Q3 15 it would be wise to look into the segment to see what Zack Ranked #1 Mutual Funds in the Technology sector are poised to capitalize on the expected growth levels in 2015. Using the Zacks Mutual Fund Rank, and then separating out funds with high expense ratios , and load fees we were able to identify 4 funds that are well positioned to capture the expected growth through FY 15. Technology Funds for 2015 Fidelity Select Electronics Portfolio (MUTF: FSELX ) a Zacks Rank #1 (Strong Buy) is designed to seek capital appreciation by investing at least 80% of assets in common stocks of companies principally engaged in the design, manufacture, or sale of electronic components (semiconductors, connectors, printed circuit boards, and other components); equipment vendors to electronic component manufacturers, electronic component distributors, and electronic instruments and electronic systems vendors. The fund offers dividends and capital gains twice a year in April and December. This fund allocates its capital between Large Cap Growth, Small Cap Value, and Foreign Stocks, and holds over 80% of their portfolio in the technology segment. The fund holds companies like Intel (NASDAQ: INTC ), Broadcom (NASDAQ: BRCM ), Texas Instruments (NASDAQ: TXN ), Samsung ( OTC:SSNLF ), and Qualcomm (NASDAQ: QCOM ). The current fund manager has been with the fund since 2009, and has shown solid gains for his (Stephen Barwikowski) clients. This tech fund has a very low expense ratio, 0.79, and has no front or back loaded fees. The minimal investment is $2,500. Past Performance: 1 year +38.37%, 3 year 25.89%, 5 year 16.36%. T. Rowe Price Global Technology Fund (MUTF: PRGTX ) a Zacks Rank #1 (Strong Buy) seeks long-term capital growth. The fund invests at least 80% of its net assets throughout the world in the common stocks of companies that generate a majority of their revenues from the development, advancement and use of technology. The fund’s holdings can range from small companies to blue chip firms with established track records. Dividends and capital gains, are declared annually in December. The fund allocates its capital between Large Cap Growth, Foreign stocks, and Intermediate Bonds. Further, the fund holds companies like Amazon (NASDAQ: AMZN ), Alibaba (NYSE: BABA ), Priceline.com (NASDAQ: PCLN ), and Qualcomm. This fund has a low expense ratio, 0.92, and does not have a front or back loaded fee. The minimal investment is $2,500. Past Performance: 1 year 24.0%, 3 year 27.44%, and 5 year 20.08%. T. Rowe Price Science And Technology Fund (MUTF: PRSCX ) a Zacks Rank #1 (Strong Buy) invests at least 80% of net assets in common stocks of companies expected by T. Rowe Price to benefit from the development, advancement, and use of science and technology. While most assets are invested in U.S. common stocks, other securities may also be purchased, including foreign stocks, futures, and options, in keeping with the fund objectives. This fund declares dividends annually in December. This fund allocates its capital between Large Cap Growth, Foreign Bonds, and Foreign Stocks. Further the fund holds companies like Amazon ( AMZN ), Altera (NASDAQ: ALTR ), Western Digital (NASDAQ: WDC ), and LinkedIn (NYSE: LNKD ). Like our other choices, this fund carries a very low expense ratio, 0.85, and is not front or back loaded. The minimal investment is $2,500. Past Performance: 1 year 12.59%, 3 year 19.79%, 5 year 14.76%. Fidelity® Select Software & Comp Portfolio (MUTF: FSCSX ) a Zacks Rank #1 (Strong Buy) seeks capital appreciation by investing at least 80% of assets in common stocks of companies principally engaged in research, design, production, or distribution of products or processes that relate to software or information-based services. The fund offers dividends and capital gains twice a year in April and December. This fund allocates its capital between Large Cap Growth stocks, Foreign Bonds, and Small Cap Growth Stocks. Further the fund holds companies like Microsoft (NASDAQ: MSFT ), Google (NASDAQ: GOOG ), Oracle (NYSE: ORCL ), Facebook (NASDAQ: FB ), and Adobe (NASDAQ: ADBE ). This fund carries a low expense ratio, 0.78, and is not front loaded but does have a back load of 0.75. The minimal investment is $2,500. Past Performance: 1 year 8.22%, 3 year 26.48%, 5 year 19.72%. Bottom Line With growth expectations outpacing the S&P 500 for the next three quarters, the Technology sector is an area to explore while many other sectors are being negatively impacted by outside economic forces. All four of these Technology Mutual Funds have large exposure to the Tech industry, and also have a portion of their position in foreign markets to hedge against the stronger dollar. A look into these 4 mutual funds may enable you to outpace the S&P 500 through most of 2015.
Hawaiian Electric Industries (HE) Q4 2014 Results – Earnings Call Webcast

The following audio is from a conference call that will begin on February 12, 2015 at 17:00 PM ET. The audio will stream live while the call is active, and can be replayed upon its completion. Are you Bullish or Bearish on ? Bullish Bearish Neutral Results for ( ) Thanks for sharing your thoughts. Submit & View Results Skip to results » Share this article with a colleague

Investing For Retirement Using Schwab Mutual Funds

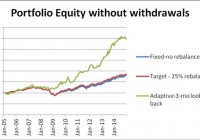
Summary Schwab offers a set of diversified mutual funds which can be successfully used for construction of investment portfolios with good withdrawal rates. A set of just three mutual funds, a bond, a large cap dividend equity growth, plus a small cap fund generates good returns with relatively low risk. From January 2005 to January 2015, a Schwab portfolio with fixed allocation could produce a safe 5% annual without any substantial decrease of the capital. Same portfolio with rebalancing at 25% deviation from the target allowed a safe 5% annual withdrawal rate with a smaller decrease of the capital. Same portfolio with momentum-based adaptive allocation could have produced a safe 10% annual withdrawal rate and 0.52% annual increase of the capital. This article belongs to a series of articles dedicated for investing in various mutual fund families. In previous articles we reported our research on Fidelity, Vanguard, T Rowe Price, and American Century mutual fund families. The current article does the same for Schwab family of mutual funds. The series of these articles is aimed at a broad spectrum of investors. They may be useful to small individual investors as well as to any large institution managing retirement accounts. The general methodology we use in selecting the funds for the portfolio was presented in a previous article. The portfolio includes three funds: one bond fund and two equity funds. The equity funds are complementary: one covers large capitalization stocks paying high dividends, the other fund contains small capitalization growth stocks. Historically, the selected funds have performed better than most other funds in their category. The mutual funds been selected for investment are the following: Schwab total bond market fund (MUTF: SWLBX ) Schwab Dividend Equity fund (MUTF: SWSCX ) Schwab Small Cap Equity fund (MUTF: SWDSX ) As in the previous articles, three different strategies are considered: (1) Fixed asset allocation. The portfolio is initially invested 50% in the bond fund and 50% equally divided between the two stock funds, without rebalancing. (2) Target asset allocation with rebalancing. The portfolio is initially invested 50% in the bond fund and 50% equally divided between the two stock funds and is rebalanced when the allocation to any fund deviates by 25% from its target. (3) Momentum-based adaptive asset allocation. The portfolio is at all times invested 100% in only one fund. The switching, if necessary, is done monthly at closing of the last trading day of the month. All money is invested in the fund with the highest return over the previous 3 months. The data for the study were downloaded from Yahoo Finance on the Historical Prices menu for three tickers: SWLBX, SWSCX, and SWDSX. We use the monthly price data from January 2005 to January 2015, adjusted for dividend payments. The paper is made up of two parts. In part I, we examine the performance of portfolios without any income withdrawal. In part II, we examine the performance of portfolios when income is extracted periodically from the accounts. Part I: Portfolios without withdrawals We report the performance of the portfolios under two scenarios: (1) no withdrawals are made during the time interval of the study, and (2) withdrawals at a fixed rate of the initial investment are made periodically. In table 1 we show the results of the portfolios managed for 10 years, from January 2005 to January 2015. Table 1. Portfolios without withdrawals 2005 – 2015. Strategy Total increase% CAGR% Number trades MaxDD% Fixed-no rebalance 79.75 5.98 0 -31.09 Target-25% rebalance 86.22 6.36 3 -31.09 Momentum-Adaptive 247.20 13.25 36 -14.74 The time evolution of the equity in the portfolios is shown in Figure 1. (click to enlarge) Figure 1. Equities of portfolios without withdrawals. Source: This chart is based on EXCEL calculations using the adjusted monthly closing share prices of securities. From figure 1 it is apparent that the rate of increase of the adaptive portfolio is substantially greater than the rate of the fixed and target allocation portfolios. Part II: Portfolios with withdrawals Assume that we invest $1,000,000 for income in retirement. We plan to withdraw monthly a fixed percentage of the initial investment. That amount is increased by 2% annually in order to account for inflation. In table 2 we show the results of the portfolios managed for 10 years, from January 2005 to January 2015. Money was withdrawn monthly at a 5% annual rate of the initial investment plus a 2% inflation adjustment. Over the 10 years from January 2005 to January 2015, a total of $535,920 was withdrawn. Table 2. Portfolios with 5% annual withdrawal rate 2005 – 2015. Strategy Total increase% CAGR% Number trades MaxDD% Fixed-no rebalance -0.21 -0.02 0 -36.32 Target-25% rebalance -0.01 -0.00 3 -37.39 Momentum-Adaptive 126.32 8.51 36 -20.50 The time evolution of the equity in the portfolios is shown in Figure 2. (click to enlarge) Figure 2. Equities of portfolios with 5% annual withdrawal rates. Source: This chart is based on EXCEL calculations using the adjusted monthly closing share prices of securities. To illustrate the advantage of the adaptive allocation strategy and the effect of withdrawal rates on the evolution of the capital, we give in Table 3 the results of simulations for the following withdrawal rates: 0%, 5%, 10%, and 12%. Table 3. Adaptive Portfolios with various annual withdrawal rates 2005 – 2015. Withdrawal rate % Total increase% CAGR% MaxDD% 0 247.20 13.25 -14.74 5 126.32 8.51 -20.50 8 53.77 4.40 -25.64 10 5.40 0.52 -30.04 The time evolution of the equity in the portfolios is shown in Figure 3. (click to enlarge) Figure 3. Equities of momentum-based portfolios with various annual withdrawal rates. Source: This chart is based on EXCEL calculations using the adjusted monthly closing share prices of securities. Conclusion The set of three Schwab mutual funds, selected for this study, perform well for all three strategies and generate sustainable returns at relatively low drawdowns. Between 2005 and 2015, the fixed target allocation with rebalancing was able to sustain withdrawal rates of up to 5% annually. The adaptive allocation algorithm was able to sustain withdrawal rates up to 10% annually without any decrease of capital. Additional disclosure: This article is the fifth in a sequence on investing in mutual funds for retirement accounts. To help the reader compare the past performance of various mutual fund families, I selected a benchmark 10-year time interval starting on 1 January 2005 and ending on 31 December 2014. The article was written for educational purposes and should not be considered as specific investment advice. Disclosure: The author has no positions in any stocks mentioned, and no plans to initiate any positions within the next 72 hours. (More…) The author wrote this article themselves, and it expresses their own opinions. The author is not receiving compensation for it (other than from Seeking Alpha). The author has no business relationship with any company whose stock is mentioned in this article.