Tag Archives: alternative

First Trust Launches Cybersecurity ETF CIBR

Rampant cybersecurity breaches have become quite prominent these days and have prompted companies to commit billions of dollars annually in hopes of preventing future attacks. This is in turn acting as a major tailwind for the U.S. cybersecurity industry. The success of the cybersecurity industry is prompting issuers to come out with funds devoted to this niche space. Most recently First Trust has launched the First Trust NASDAQ CEA Cybersecurity ETF , which trades under the ticker CIBR . CIBR in Details The newly-launched ETF tracks the Nasdaq CEA Cybersecurity Index to provide exposure to the performance of companies engaged in the cybersecurity segment of the technology and industrials sectors. The fund includes companies primarily involved in the building, implementation, and management of security protocols applied to private and public networks, computers, and mobile devices in order to provide protection of the integrity of data and network operations. This approach results in the fund holding a small basket of 34 stocks. Qihoo 360 Technology Co. Ltd (NYSE: QIHU ) takes the top spot with 7.05% exposure, followed by Palo Alto Networks, Inc. and FireEye, Inc., each with over 6% exposure. Software dominates the fund with a little less than 50% exposure, followed by Communications Equipment and Internet Software & Services, each with double-digit allocation. The fund charges 60 basis points as fees. How Does it Fit in a Portfolio? The fund provides a good opportunity for investors to play the niche area of cyber security. Cybersecurity breaches have been witnessed in almost every industry, with some of the big shot companies such as JPMorgan Chase (NYSE: JPM ), eBay (NASDAQ: EBAY ) and Apple (NASDAQ: AAPL ) been among the victims this year. According to a report by McAfee, cyber crime cost the world economy $400 billion in 2014. Per KPMG, a professional services firm, cyber crime is expected to cost the world an enormous $560 billion per year . Thus with the huge demand for companies in the cybersecurity industry, investors would be better off in investing in this fund. ETF Competition Cybersecurity is a quite a new area and there is currently just one fund focused on this space. ISE Cyber Security ETF (NYSEARCA: HACK ) with an asset base of $1.3 billion is the first product in the space and trades with good volumes of 1 million shares. The fund tracks the ISE Cyber Security Index. The index tracks the performance of companies actively engaged in providing services for the cybersecurity industry. These cybersecurity services are designed to protect computer hardware, software, networks and data from unauthorized access, vulnerabilities, attacks and other security breaches. The equal weighted fund presently holds a basket of 31 stocks, with Intralinks Holding, Vasco Data and Proofpoint Inc being the top three holdings, each comprising a little more than 4% of total fund assets. As far as the sub-industry breakdown is concerned, the fund has roughly the same exposure as CIBR. However, HACK is a little costly than CIBR and charges 75 basis points as fees. CIBR thus has a good chance of gaining popularity if we consider its expense ratio. Even if we don’t take into account the expense ratio, the huge demand for cybersecurity stocks should help the newly launched ETF gather reasonable assets. Original Post

New Alternative ETF Takes Income Generating Seriously

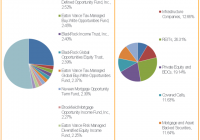
Income investors may look at alternative assets to garner attractive yields. ETF options that provide attractive dividends. Focus on the Global X suite of SuperDividend ETFs. By Todd Shriber & Tom Lydon Investors are still searching for ways to generate income. Home to asset classes including business development companies (BDCS), private equity, closed-end funds, covered call funds and others, the alternatives space is a credible source of high income and yields. Enter the Global X SuperDividend Alternatives ETF (NASDAQ: ALTY ) , which debuted today. ALTY is the latest member of Global X’s SuperDividend suite , becoming the sixth ETF in a group that includes well-known products such as the Global X SuperDividend ETF (NYSEARCA: SDIV ) and the Global X SuperDividend U.S. ETF (NYSEARCA: DIV ). ALTY tracks the Indxx SuperDividend Alternatives Index. The new ETF offers investors exposure to an array of income-generating asset classes including a 26.3% weight to real estate investment trusts (REITs), a 19.1% allocation to BDCs and private equity and an 8.5% weight to master limited partnerships (MLPs). The new ETF also features 11.6% weights to covered call strategies and mortgage- and asset-backed securities, according to Global X data . BDCs have increased in popularity among investors for one big reason: Tantalizing dividend yields. However, with Treasury yields on the rise, some high-yielding asset classes are proving vulnerable, meaning investors should take the time to assess positions in BDCs and the corresponding exchange traded funds. BDCs are closed-end investment companies created under the Investment Company Act of 1940 that invest in debt and equity of small public and privately-held companies. The companies essentially help fund small $5 million to $100 million businesses. Ever since the financial crisis, regulators have clamped down on traditional lenders and made it harder for businesses to access public capital, which has forced smaller business to take loans from BDCs. ALTY delivers on the income promise via of a fund-of-funds approach as top 10 holdings are other funds, including a 26.3% weight to the Global X SuperDividend REIT ETF (NASDAQ: SRET ) . SRET, by far ALTY’s largest holding, debuted in March. “As a result of their stable earnings, REITs have demonstrated less volatility than equity prices. Global REIT volatility from 2010 – 2014 was 15.3% as compared to 16% of S&P 500. This stability has contributed to higher risk-adjusted returns as observed by Sharpe Ratio. The Sharpe Ratio for global REITs in 2014 was 2.11 as compared to a Sharpe Ratio of 1.01 for S&P 500,” said Global X, citing Bloomberg data. Alternative assets have other advantages in addition to income-generating potential. “Alternatives are generally known for lower volatility compared to equities. ALTY’s index methodology seeks to further reduce volatility through its selection and weighting of components. Alternative income is often generated from sources with low correlation to equities and traditional fixed income, such as real assets, private equity, and derivative strategies,” according to Global X . However, those advantages come at a cost. As ALTY holds multiple asset classes across multiple funds, the new ETF’s expense ratio is 3.03%, which is high by the standards of most actively-managed mutual funds, let alone passively-managed ETFs. ALTY pays its dividend on a monthly basis. (click to enlarge) Charts Courtesy: Global X Disclosure: I/we have no positions in any stocks mentioned, and no plans to initiate any positions within the next 72 hours. (More…) I wrote this article myself, and it expresses my own opinions. I am not receiving compensation for it. I have no business relationship with any company whose stock is mentioned in this article.
CAF: Trading At 20%+ Discount To NAV Due To Supply/Demand Imbalance

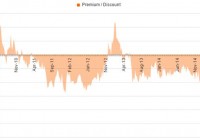
Summary Wave of investor outflows has created a significant dislocation. This provides an opportunity for those constructive on the Chinese market to obtain cheap exposure. For the rest of us, it also presents some potential to capture alpha through pair trades. Background on Closed-End Funds For those new to the space, a closed-end fund is a publicly traded investment company that raises a fixed amount of capital, and is then structured, listed and traded like a stock on a stock exchange. Whereas conventional mutual funds and ETFs frequently redeem/issue new shares to ensure that the price per share remains in line with the net asset value of the underlying holdings in the funds, this is not the case for CEFs. Rather the share price of CEFs is driven by the market forces of supply and demand, and can at times trade at either large discounts or premiums to NAV of the funds’ actual holdings. The Morgan Stanley China A Share Fund (NYSE: CAF ) is currently trading at one of the widest discounts in the CEF universe, due to a classic supply/demand imbalance. In particular, the Western media has inundated investors recently with headlines concerning the risks of a Chinese economic slowdown coupled with a potential bubble in the local equity market nearing its peak. The result is that the supply of CAF shares flooding the market from investors rushing to sell has overwhelmed demand, causing this CEF to now trade for a whopping ~20% below its NAV. In other words, for every $1 of net assets in the fund, investors now only need to pay ~80 cents to buy shares. (click to enlarge) Source: CEF Connect Morgan Stanley China A Share Fund Overview CAF is a reasonably large/liquid fund, with ~$936 million of total net asset value. The fund’s mandate is to invest at least 80% of its assets in A-shares of Chinese companies listed on the Shanghai and Shenzhen Stock Exchanges. Morgan Stanley is a longstanding/reputable CEF manager and the 3 executive/managing directors overseeing the fund each have more than a decade of experience in the Chinese market. The fund has a moderate annual expense ratio of 1.8%, and is currently relatively concentrated as shown in the table below. Also, the cash balance is now quite elevated (representing ~16% of NAV), which I view as a meaningful positive – after all, it’s hard to argue that cash in the hands of a reputable manager deserves a big discount. Plus, it gives the manager ammunition to take steps like share buybacks in the future to reduce the discount. Top 10 Holdings as of 5/31/15 % Of Portfolio Cash 16.1 Tsingtao Brewery Co., Ltd. Class A 10.0 China Resources Sanjiu Medical & Pharmaceutical Co., Ltd. Class 9.6 Industrial & Commercial Bank of China Ltd. Class A 8.7 Qingdao Haier Co., Ltd. Class A 5.2 China Pacific Insurance Group Co., Ltd. Class A 5.1 GoerTek, Inc. Class A 5.0 China Merchants Bank Co., Ltd. Class A 4.9 Kweichow Moutai Co., Ltd. Class A 4.4 Zhongbai Holdings Group Co., Ltd. Class A 3.7 Total 72.7 Source: Morgan Stanley CAF’s investor base is reasonably concentrated, with institutions holding approximately 37% of shares outstanding. Notably, Lazard holds ~$117mm or ~16% of total shares outstanding. This is also something I like to see when considering investing in a CEF that trades at a discount to NAV, as institutions holding major stakes are more likely than small individual/retail holders to pressure management to take steps to narrow the discount if this does not occur naturally over time. Source: NASDAQ So, What’s the Trade? For investors that want exposure to the local Chinese equity market, this CEF appears to be an attractive vehicle that is likely to deliver alpha from the discount reverting to more normalized levels over time. For others that have a more cautious view on the Chinese market (myself being one), there are also some potential opportunities to capture this alpha through pairing a long position in CAF with a short position in a Chinese equity ETF. There are several possible shorts to consider, but I present a couple below. CSOP FTSE China A50 ETF (NYSEARCA: AFTY ): This is a relatively small ETF with approximately $135mm of net assets. However, trading volume is reasonable, with ~$2.6mm/day in shares trading on average over the past 3 months. It is also currently relatively easy to borrow, with a cost under 2% through some retail brokers. The fund typically invests at least 80% of its total assets in the securities included in the FTSE China A50 index. This index is comprised of A-shares issued by the 50 largest companies in the China A-shares market. Direxion Daily FTSE China Bull 3X Shares ETF (NYSEARCA: YINN ): This alternative has more basis risk, but could also have the potential to produce more alpha. The fund has ~$181mm of net assets, with average daily trading volume of ~$20mm. YINN is not overly difficult to borrow, with a cost under 5.5% through some retail brokers currently. YINN seeks daily investment results, before fees and expenses, of 300% of the performance of the FTSE China 50 Index. This index consists of 50 of the largest and most liquid Chinese stocks (H Shares, Red Chips and P Chips) listed and trading on the Stock Exchange of Hong Kong, and is therefore a less tight match with CAF’s A share holdings. However, a potential benefit of shorting YINN is that one may benefit from the general tendency of levered ETFs to underperform over longer periods of time. There are several reasons for their underperformance including what is often referred to as a “leverage trap” (i.e., their tendency to decay in mean reverting markets from being forced to buy high/sell low), as well as elevated expenses that result from the higher trading activity needed to maintain these vehicles. The phenomenon is discussed in much more depth in academic literature (such as in this article ), as well as elsewhere on Seeking Alpha (such as here ). Risks/Considerations The main risk of this trade is that the timing of discount convergence is unclear, and if investors’ macro fears over China grow, there is a possibility that the discount could increase even further over the near term. The main mitigants are the facts that, as discussed above, the investor base is relatively concentrated with institutional investors, and the fund manager is reputable with dry powder in the form of excess cash to reduce the discount if it persists over time. Short selling of course also comes with added risks (e.g., possibility of force buy-ins, increasing borrow costs, etc.) and likely should not be attempted by those new to the market. Disclosure: I/we have no positions in any stocks mentioned, but may initiate a long position in CAF over the next 72 hours. (More…) I wrote this article myself, and it expresses my own opinions. I am not receiving compensation for it (other than from Seeking Alpha). I have no business relationship with any company whose stock is mentioned in this article.