Tag Archives: alt-investing

Portfolio Report Card: A $1.23 Million Portfolio Built On The Wrong Foundation
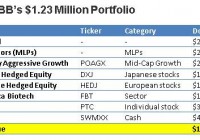
By Ronald Delegge From an observer’s viewpoint, the individual with a good sized investment portfolio (say above $1 million) doesn’t have much to worry about. They’ve got lots of money and that’s all that matters. Unfortunately, this misinformed view isn’t just dead wrong, but it incorrectly presumes the person with a large portfolio has done everything right. Is it true? First, let’s be explicitly clear: Being a good accumulator doesn’t automatically make a person a good investor. And based upon what I’ve seen, the number of good savers easily outnumbers the quantity of good investors. In other words, having a large investment portfolio is a wonderful convenience, but it doesn’t necessarily mean that your investments are correctly invested or properly aligned. My latest Portfolio Report Card is for BB, a late 60s retiree living in Naples, FL. He manages his own investments and told me he watches his money “like a hawk.” BB’s $1,236,939 million portfolio consists of a taxable brokerage account that contains one hedge fund, one mutual fund, one individual stock, three ETFs, a managed portfolio of energy master limited partnerships (MLPs), and some cash. BB asked me to do a Portfolio Report Card analysis to find out the strengths and weaknesses of his investments. What kind of grade does BB’s portfolio get? Let’s analyze and grade it together. Cost Investing is not a cost-free activity and your net performance is directly tied to how well or poorly you contain the cost of your investment portfolio. Sadly, most people are so distracted that minimizing trading activity, cutting fund expenses, and reducing other unnecessary fees isn’t a priority. BB’s portfolio owns one hedge fund, one separately managed account, one mutual fund, three ETFs, one individual stock, and cash. The mutual fund and ETF holdings have asset weighted expenses of 0.57% while the separately managed MLP account charges 1%. The cost of this portfolio is 65% more expensive compared to our ETF benchmark. Put another way, BB has too much fat in his portfolio. Diversification The hallmark of genuinely diversified investment portfolios is broad market exposure to the five major asset classes: Stocks, bonds, commodities, real estate, and cash. How does BB’s portfolio do? His portfolio has exposure to U.S. and international stocks, energy MLPs and cash. However, the portfolio lacks broad diversification to stocks because the funds he owns like the First Trust NYSE Arca Biotechnology Index ETF (NYSEARCA: FBT ) are sector focused. Likewise, the other funds he owns like the WisdomTree Japan Hedged Equity ETF (NYSEARCA: DXJ ) and the WisdomTree Europe Hedged Equity ETF (NYSEARCA: HEDJ ) engage in tactical strategies that concentrate exposure in a certain segment of the stock market. The same is true of his PRIMECAP Odyssey Aggressive Growth Fund (MUTF: POAGX ), which only owns a narrow segment of the stock market, mid-cap growth stocks. Although BB owns energy MLPs, this only covers one narrow segment of the entire commodities market. In summary, BB’s portfolio comes up short on diversification because of its highly concentrated, plus it lacks broad exposure to three major asset classes: real estate, commodities, and bonds. Risk Your portfolio’s risk character should always be 100% compatible with your capacity for risk and volatility along with your financial circumstances, liquidity requirements, and your age. BB’s overall asset mix of this total portfolio is the following: 76% stocks, 20% energy MLPs and 4% cash. Clearly, BB’s exposure to equities is elevated for his age group and doesn’t leave him much cushion if market conditions suddenly change. Although BB is financially versed, his risk management techniques could use an overhaul. Put another way, a 20% to 40% stock market decline would expose BB’s portfolio to potential market losses of $188,000 to $375,000. Tax Efficiency Smartly designed investment portfolios are always aggressive at reducing the threat of taxes. This can be achieved by owning tax-efficient investment vehicles like index funds or ETFs along with using smart asset location strategies. BB told me he’s been using tax losses carried over from previous years to offset his current portfolio’s tax liabilities. While this is good, the tax efficiency of BB’s portfolio can still be better. For example, the energy MLPs are not a tax-efficient asset yet they’re held in a taxable investment account. Performance Your portfolio’s performance is indeed the bottom line, but it’s never the only line. That’s because your performance return – good or bad – is directly impacted by your portfolio’s cost, risk, diversification, and taxes. How does BB’s portfolio do? This portfolio gained $27,000 (BB withdrew $60,000) and its one-year performance return from JAN 2014-JAN 2015 was (7.12%) vs. a gain of +3.77% gain for the index benchmark matching this same asset mix. Investment performance should match or exceed the benchmark and BB’s one-year performance is satisfactory. The Final Grade BB’s final grade is “C” (weak). Although BB’s one-year performance return was satisfactory, his performance is largely attributable to lots of luck along with a cooperative stock market versus financial acumen. Furthermore, it’s highly doubtful that BB’s equity heavy portfolio would deliver satisfactory performance in a different market climate. BB’s portfolio scored poorly at minimizing cost, maximizing diversification, and having a risk profile that is age-appropriate. Fixing these portfolio defects should be his priority. I’m especially concerned that BB has made non-core assets like hedge funds, sector ETFs, and tactically niche equity funds core components within his portfolio. This is a fundamental error. Substituting highly concentrated or leveraged non-core assets in the place of broadly diversified core assets inside your core portfolio is comparable to building a home on unstable terrain. In summary, if BB fixes the weaknesses within his portfolio, I believe satisfactory performance returns should become a regular thing versus a one-year anomaly. Ron DeLegge is the Founder and Chief Portfolio Strategist at ETFguide. Ron’s Portfolio Report Card grading system has been used to evaluate more than $100 million in portfolios and helps people to identify the strengths and weaknesses of their investment account, IRA, and 401(k) plan. Disclosure: No positions unless otherwise indicated Link to the original post on ETFguide.com

ETF Deathwatch For June 2015: List Grows To 323

The ETF Deathwatch membership roll grew eight names larger for June. Seventeen products were added and nine came off. Escapees included seven products with improved health and two that closed up shop. The count now stands at 323, consisting of 225 ETFs and 98 ETNs. Actively managed ETFs continue to have a disproportionally large representation with nearly half of the eligible funds showing up on the list. Product deaths reached a major milestone last month, attaining the level of 500 closures . Funds offering +/- 200% leveraged market exposure were extremely popular with day-traders and the high frequency trading crowd when they were introduced. As noted in the past, these traders have been migrating toward the 300% leveraged funds for the extra “juice” they provide. ProShares Ultra S&P Regional Banking (NYSEARCA: KRU ) is an example of a 200% long product targeting an industry that has been performing quite well lately. It is up more than twice as much as the broader and more leveraged Direxion Daily Financial Bull 3x Shares (NYSEARCA: FAS ) over the past month. Despite its much better performance, KRU is joining ETF Deathwatch this month, while FAS has more than $1 billion in assets and averaged $144 million in daily trading the past three months. Today, 40 products using 200% leverage are on ETF Deathwatch versus only seven that use 300% leverage. Smart beta seems to be a very popular theme in the ETF space these days, and it is difficult to go more than a few days without some article making reference to it. However, it takes more than tagging an ETF as a “smart beta” product to ensure success. FlexShares Credit-Scored US Corporate Bond (NASDAQ: SKOR ) and PowerShares DB Optimum Yield Diversified Commodity Strategy (NASDAQ: PDBC ), smart beta funds targeting bonds and commodities, respectively, were added to ETF Deathwatch this month. The primary concern with any of these products is liquidity. It is always prudent to have an exit plan before making your purchase, and this usually entails knowing what will prompt you to sell. A key ingredient is having someone willing to buy your shares at a fair price when you are ready to sell. There were 233 ETFs and ETNs that had zero volume on the last day of May. More than 13% of all listed products did not trade that day. Additionally, there were 21 funds that went the entire month without seeing any action. Today, the iPath Long Extended Russell 1000 ETN (NYSEARCA: ROLA ) is being quoted with a bid of $170.01 and an asking price of $276.34, creating a $106.33 spread. Its last trade occurred on January 8, 2015. Even if you could buy ROLA at a discount, who will buy your shares when you want to sell? The average asset level of products on ETF Deathwatch decreased from $6.9 million to $6.8 million, and 49 currently have less than $2 million in assets. The average age increased from 47.2 to 48.3 months, and 99 are now more than five years old. Here is the Complete List of 323 Products on ETF Deathwatch for June 2015 compiled using the objective ETF Deathwatch Criteria . The 17 ETPs added to ETF Deathwatch for June: C-Tracks Citi Volatility Index TR ETN (NYSEARCA: CVOL ) ETRACS CMCI Gold TR ETN (NYSEARCA: UBG ) ETRACS CMCI Livestock TR ETN (NYSEARCA: UBC ) ETRACS Daily Long-Short VIX ETN (NYSEARCA: XVIX ) Huntington US Equity Rotation Strategy (NYSEARCA: HUSE ) iShares Industrials Bond (NYSEARCA: ENGN ) ProShares CDS Short North America HY Credit (BATS: WYDE ) ProShares Global Listed Private Equity (BATS: PEX ) ProShares Ultra S&P Regional Banking ( KRU ) ProShares UltraShort MSCI EAFE (NYSEARCA: EFU ) RBS China Trendpilot ETN (NYSEARCA: TCHI ) WisdomTree Indian Rupee Strategy (NYSEARCA: ICN ) First Trust Emerging Markets Local Bond ETF (NASDAQ: FEMB ) First Trust International IPO ETF (NASDAQ: FPXI ) First Trust Low Duration Mortgage Opportunities (NASDAQ: LMBS ) FlexShares Credit-Scored US Corporate Bond ( SKOR ) PowerShares DB Optimum Yield Diversified Commodity Strategy ( PDBC ) The 7 ETPs removed from ETF Deathwatch due to improved health: ALPS STOXX Europe 600 ETF (NYSEARCA: STXX ) DB 3x German Bund Futures ETN (NYSEARCA: BUNT ) iShares Interest Rate Hedged Corporate Bond (NYSEARCA: LQDH ) iShares MSCI Europe Minimum Volatility (NYSEARCA: EUMV ) iShares MSCI Japan Minimum Volatility (NYSEARCA: JPMV ) PowerShares S&P Intl Developed High Beta (NYSEARCA: IDHB ) ProShares MSCI EAFE Dividend Growers (NYSEARCA: EFAD ) The 2 ETPs removed from ETF Deathwatch due to delisting: Deutsche X-trackers In-Target Date (NYSEARCA: TDX ) Deutsche X-trackers 2010 Target Date (NYSEARCA: TDD ) Disclosure covering writer: No positions in any of the securities mentioned . No positions in any of the companies or ETF sponsors mentioned. No income, revenue, or other compensation (either directly or indirectly) received from, or on behalf of, any of the companies or ETF sponsors mentioned.

Grexit Fears And Fed Meeting Put These ETFs In Focus

This week started with a rough stock market session as major benchmarks finished the day in the red. The Dow Jones Industrial Average fell more than 200 points in early Monday trading and was down 0.6% at the close. In fact, the steep decline eroded all the gains made this year and sent the Dow Jones into red from the year-to-date look as well. The downswing has mainly been blamed on growing concerns over the future of Greece in the Euro zone. Tensions on Rise The latest talk between Greece and its international creditors collapsed yet again last weekend, sparking off threats of default and a possible Greek exit from the Euro zone. The move sent panic alarms ringing all over the globe and renewed uncertainty in the global stock market. Notably, the Greek bourse fell 4.9% on Monday trading session, spreading the contagion across the European, Asian and U.S. markets. Added to the Greece concern is the Federal Reserve’s two-day meeting, which ends on Wednesday. Investors have been cautious and are keeping a close eye at this meeting to find out whether the Fed Chair Janet Yellen modifies the language regarding the rates hike or adds some color to the decision. While the Fed will not raise interest rates at this meeting, a spate of better-than-expected economic data has raised speculation for a hike in September or October. The Fed is expected to release its policy statement, economic outlook and interest rate forecasts at the end of the ongoing meeting. Market Impact The events have led to risk-off trading with lower risk securities, including precious metals and bonds, in vogue. Meanwhile, the broad U.S. market fund (NYSEARCA: SPY ) saw volume that exceeded 124 million shares on the day, well above average shares of roughly 105 million. A few ETFs were severely impacted by the news of the Greece deal failure while a few were in focus ahead of the Fed meeting. Below are four ETFs which are especially volatile in the wake of the Greece crisis and amid uncertainty regarding the timing of the interest rates hike: Global X FTSE Greece 20 ETF (NYSEARCA: GREK ) The Greece ETF was the worst performer on the day, losing 6.5% on elevated volume of 1.5 million shares compared to 815,000 shares on average. The fund tracks the FTSE/ATHEX Custom Capped Index and is home to a small basket of 21 companies. It is heavily concentrated on the top firm – Coca Cola HBC – at nearly 21% while other firms make up for less than 10% share. Financials takes the top spot at 25% in terms of sector holdings, followed by consumer staples (21%), consumer discretionary (16%) and telecom (10%). The product has AUM of $330 million and charges 61 bps in fees per year from investors. iPath S&P 500 VIX Short-Term Futures ETN (NYSEARCA: VXX ) While volatility products have been terrible performers over the medium and long terms due to a contangoed market and a steep roll cost, they are intriguing picks during periods of turmoil or uncertainty. That being said, VXX gained 4.2% in the session while volume hit 56.4 million shares, well above the 39.1 million average. The note has amassed $1.1 billion in AUM and charges 89 bps in fees per year. The ETN focuses on the S&P 500 VIX Short-Term Futures Index, which reflects implied volatility in the S&P 500 Index at various points along the volatility forward curve. It provides investors with exposure to a daily rolling long position in the first and second months VIX futures contracts. SPDR Gold Trust ETF (NYSEARCA: GLD ) Gold is often viewed as a store of value and a hedge against market turmoil. The product tracking this bullion like GLD could be an interesting pick to play the market turbulence. The fund tracks the price of gold bullion measured in U.S. dollars, and kept in London under the custody of HSBC Bank USA. It is the ultra-popular gold ETF with AUM of $26.7 billion and expense ratio of 0.40%. However, the ETF added just 0.4%, exchanging more than 500,000 shares in hand. The upside was capped in anticipation of a hawkish stance in the Fed meeting that would further boost the dollar against the basket of major currencies and dampen the safe haven appeal across the board. iShares 20+ Year Treasury Bond ETF (NYSEARCA: TLT ) The U.S. government bonds tracking the long end of the yield curve often carry a safe haven status. The flight-to-safety on Greece default concerns led these bonds higher in early trading but soon eroded most of the gains on rising rates concern. As such, the ultra-popular long-term Treasury ETF – TLT – was up only 0.2% on the day on below average daily volume. It tracks the Barclays Capital U.S. 20+ Year Treasury Bond Index and has AUM of over $4.3 billion. Expense ratio came in at 0.15%. Holding 30 securities in its basket, the fund focuses on the top credit rating bonds with average maturity of 26.90 years and effective duration of 17.20 years. Original post