Portfolio Report Card: A $1.23 Million Portfolio Built On The Wrong Foundation
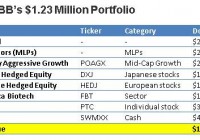
By Ronald Delegge From an observer’s viewpoint, the individual with a good sized investment portfolio (say above $1 million) doesn’t have much to worry about. They’ve got lots of money and that’s all that matters. Unfortunately, this misinformed view isn’t just dead wrong, but it incorrectly presumes the person with a large portfolio has done everything right. Is it true? First, let’s be explicitly clear: Being a good accumulator doesn’t automatically make a person a good investor. And based upon what I’ve seen, the number of good savers easily outnumbers the quantity of good investors. In other words, having a large investment portfolio is a wonderful convenience, but it doesn’t necessarily mean that your investments are correctly invested or properly aligned. My latest Portfolio Report Card is for BB, a late 60s retiree living in Naples, FL. He manages his own investments and told me he watches his money “like a hawk.” BB’s $1,236,939 million portfolio consists of a taxable brokerage account that contains one hedge fund, one mutual fund, one individual stock, three ETFs, a managed portfolio of energy master limited partnerships (MLPs), and some cash. BB asked me to do a Portfolio Report Card analysis to find out the strengths and weaknesses of his investments. What kind of grade does BB’s portfolio get? Let’s analyze and grade it together. Cost Investing is not a cost-free activity and your net performance is directly tied to how well or poorly you contain the cost of your investment portfolio. Sadly, most people are so distracted that minimizing trading activity, cutting fund expenses, and reducing other unnecessary fees isn’t a priority. BB’s portfolio owns one hedge fund, one separately managed account, one mutual fund, three ETFs, one individual stock, and cash. The mutual fund and ETF holdings have asset weighted expenses of 0.57% while the separately managed MLP account charges 1%. The cost of this portfolio is 65% more expensive compared to our ETF benchmark. Put another way, BB has too much fat in his portfolio. Diversification The hallmark of genuinely diversified investment portfolios is broad market exposure to the five major asset classes: Stocks, bonds, commodities, real estate, and cash. How does BB’s portfolio do? His portfolio has exposure to U.S. and international stocks, energy MLPs and cash. However, the portfolio lacks broad diversification to stocks because the funds he owns like the First Trust NYSE Arca Biotechnology Index ETF (NYSEARCA: FBT ) are sector focused. Likewise, the other funds he owns like the WisdomTree Japan Hedged Equity ETF (NYSEARCA: DXJ ) and the WisdomTree Europe Hedged Equity ETF (NYSEARCA: HEDJ ) engage in tactical strategies that concentrate exposure in a certain segment of the stock market. The same is true of his PRIMECAP Odyssey Aggressive Growth Fund (MUTF: POAGX ), which only owns a narrow segment of the stock market, mid-cap growth stocks. Although BB owns energy MLPs, this only covers one narrow segment of the entire commodities market. In summary, BB’s portfolio comes up short on diversification because of its highly concentrated, plus it lacks broad exposure to three major asset classes: real estate, commodities, and bonds. Risk Your portfolio’s risk character should always be 100% compatible with your capacity for risk and volatility along with your financial circumstances, liquidity requirements, and your age. BB’s overall asset mix of this total portfolio is the following: 76% stocks, 20% energy MLPs and 4% cash. Clearly, BB’s exposure to equities is elevated for his age group and doesn’t leave him much cushion if market conditions suddenly change. Although BB is financially versed, his risk management techniques could use an overhaul. Put another way, a 20% to 40% stock market decline would expose BB’s portfolio to potential market losses of $188,000 to $375,000. Tax Efficiency Smartly designed investment portfolios are always aggressive at reducing the threat of taxes. This can be achieved by owning tax-efficient investment vehicles like index funds or ETFs along with using smart asset location strategies. BB told me he’s been using tax losses carried over from previous years to offset his current portfolio’s tax liabilities. While this is good, the tax efficiency of BB’s portfolio can still be better. For example, the energy MLPs are not a tax-efficient asset yet they’re held in a taxable investment account. Performance Your portfolio’s performance is indeed the bottom line, but it’s never the only line. That’s because your performance return – good or bad – is directly impacted by your portfolio’s cost, risk, diversification, and taxes. How does BB’s portfolio do? This portfolio gained $27,000 (BB withdrew $60,000) and its one-year performance return from JAN 2014-JAN 2015 was (7.12%) vs. a gain of +3.77% gain for the index benchmark matching this same asset mix. Investment performance should match or exceed the benchmark and BB’s one-year performance is satisfactory. The Final Grade BB’s final grade is “C” (weak). Although BB’s one-year performance return was satisfactory, his performance is largely attributable to lots of luck along with a cooperative stock market versus financial acumen. Furthermore, it’s highly doubtful that BB’s equity heavy portfolio would deliver satisfactory performance in a different market climate. BB’s portfolio scored poorly at minimizing cost, maximizing diversification, and having a risk profile that is age-appropriate. Fixing these portfolio defects should be his priority. I’m especially concerned that BB has made non-core assets like hedge funds, sector ETFs, and tactically niche equity funds core components within his portfolio. This is a fundamental error. Substituting highly concentrated or leveraged non-core assets in the place of broadly diversified core assets inside your core portfolio is comparable to building a home on unstable terrain. In summary, if BB fixes the weaknesses within his portfolio, I believe satisfactory performance returns should become a regular thing versus a one-year anomaly. Ron DeLegge is the Founder and Chief Portfolio Strategist at ETFguide. Ron’s Portfolio Report Card grading system has been used to evaluate more than $100 million in portfolios and helps people to identify the strengths and weaknesses of their investment account, IRA, and 401(k) plan. Disclosure: No positions unless otherwise indicated Link to the original post on ETFguide.com