Tag Archives: alt-investing

3 ETF Winners And A Loser Post Fed Meeting

The latest Fed meeting was arguably the most closely eyed one in quite some time, as investors highly wagered on a September timeline liftoff for the first rate hike in nine years. Expectations of strong cues on the looming policy normalization were not washed away as the meeting was pretty meaningful and informative for the global asset classes. First of all, the Fed appeared pleased with the pickup in the U.S. economic growth in the second quarter of 2015, but not overenthusiastic. The Fed sees the current momentum as ‘ moderate ‘. Job growth numbers and an uptick in housing data were reasonably satisfactory but sluggish business fixed investment and net exports were the causes of concerns for the Fed. Inflation is still short of the Fed’s longer-term target due to the free fall in energy prices last year and declining prices of non-energy related imports, per the Fed minutes. The Fed expects the price index to remain under pressure in the near term, though it will perk up in the medium term. The Fed made it clear that it is well on its way to tighten the policy some time this year, but to reciprocate to this lukewarm economic recovery, it indicated a slower pace of rate hike when the step is actually taken. Added to this, the Fed slashed its projection for the benchmark interest rate for 2016 and 2017, though the guidance for the ongoing year was kept unchanged. The median estimate for 2016 was cut to 1.625% from 1.875% guided in March, and for 2017, it was reduced to 2.875% from 3.125% projected in March. If this was not enough, the Fed lowered the expectation for real GDP for 2015 to 1.8-2.0% from 2.3-2.7% guided in March. Market Impact The reductions combined prompted some big moves in various markets and asset classes as traders started to adjust their positions according to the Fed’s actions. The U.S. dollar was among the big movers as it slipped to a three-week low following the cut in longer-term U.S. interest rates forecast, per Bloomberg. Yield on the benchmark 10-Year U.S. Treasury note remained 2.32% for the last two days (ended June 17, 2015) mostly due to ‘Grexit’ worries which suddenly bolstered the appeal for the safe haven assets despite rate hike concerns in the U.S. In the fixed income market, short-term bonds were among the gainers. Below we discuss a few ETFs which were among the biggest movers after the Fed minutes and could remain in focus as there appears no maddening rush to normalize interest rates. Dollar – The Loser PowerShares DB USD Bull ETF (NYSEARCA: UUP ) This fund is the prime beneficiary of the rising dollar as it offers exposure against a basket of world currencies. These include the euro, Japanese yen, British pound, Canadian dollar, Swedish krona and Swiss franc. This is done by tracking the Deutsche Bank Long US Dollar Index Futures Index Excess Return plus the interest income from the fund’s holdings in U.S. Treasury securities. Needless to say, the fund underperforms in a falling dollar scenario. In terms of holdings, UUP allocates nearly 58% in euro and 25% together in Japanese yen and British pound. The fund has managed an asset base of $1.42 billion so far and it sees an average daily volume of 3 million shares. It charges 75 bps in total fees and expenses. Due to intense selling pressure, this dollar ETF was down about 0.9% at the close of trading on June 17, 2015 and lost over 1% after hours. The Gainers Gold Mining – Market Vectors Gold Miners ETF (NYSEARCA: GDX ) As soon as the greenback dips, commodity prices rise. Gold, one of the key precious metals, has emerged from the slump. SPDR Gold Shares (NYSEARCA: GLD ) tracking the gold bullion added about 0.5% (as of June 17, 2015), while the largest big-cap gold mining ETF, GDX , added about 2.9% on the same day. The latter saw more gains as it often trades as a leveraged play on gold. However, investors should note that the gains were short-lived as both ETFs were down after hours. GDX fell 0.4% while GLD lost 0.1% after the market closed. GDX is one of the popular gold mining ETFs in the market today with assets of $6.04 billion and a trading volume of roughly 35 million shares a day. The fund charges an expense ratio of 53 basis points a year. GDX is heavy on Canada with more than 50% focus. Short-term Treasury – iShares 1-3 Year Treasury Bond ETF (NYSEARCA: SHY ) The reduction in rate projections and a somewhat soft tone of the Fed regarding the rate hike made short-term Treasury ETFs a winner. This fund tracks the Barclays U.S. 1-3 Year Treasury Bond Index and holds 98 securities in its basket. The fund has an average maturity of 1.84 years and effective duration of 1.82 years. SHY is the most popular and most liquid ETF in the short-term bond space with AUM of $8.74 billion and average daily volume of more than 1.4 million shares. Expense ratio came in at 0.44% and its yield stands at 0.44%. The fund was up 0.02%. Emerging Market Dividend – ALPS Emerging Sector Dividend Dogs ETF (NYSEARCA: EDOG ) An indication of a sluggish trail of rate hike made emerging markets ETFs strong performers, while the dovish policy (presumably) brightened the dividend investing theme. This fund applies the ‘Dogs of the Dow Theory’ on a sector-by-sector basis. It reflects the performance of the emerging market equities with above-average dividend yields. The fund gives investors roughly equal exposure to all the sectors. This approach results in a portfolio of about 50 stocks with each security accounting for less than 2.79% of total assets. EDOG has accumulated $12 million in AUM. It charges 60 bps in annual fees and has an annual dividend yield of 3.79%. The fund was up 1.17% on June 17, 2015. Original Post
Comparing 4 International Real Estate ETFs

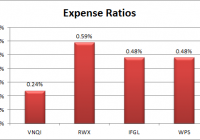
Summary I’m comparing VNQI, RWX, IFGL and WPS to find the best international real estate ETF. The results are split as no ETF won on all 3 metrics. Out of the 4, my favorite is VNQI, but I am concerned about the exposure to the Chinese market. The Vanguard Global ex-U.S. Real Estate Index Fund ETF (NASDAQ: VNQI ) is one of the best investments in international REITs. Unfortunately, it is also one of the only ones. This is an area of the market where the volume of competition is not particularly high and lower levels of competition can lead to lower levels of returns as companies are not battling to attract the consumer with the best value. I thought it would be worthwhile to compare VNQI with a few of the other options that are available to investors. For instance, investors may also be considering the SPDR® Dow Jones International Real Estate ETF (NYSEARCA: RWX ), the iShares International Developed Real Estate ETF (NASDAQ: IFGL ), or the iShares International Developed Property ETF (NYSEARCA: WPS ). Expense Ratios Due to a lack of competition, expense ratios in this space may be higher than in other areas. That’s unfortunate for investors and may give some investors good reason to look for other types of international exposure that have lower expense ratios. For instance, buying into ETFs that are investing in international companies rather than focused on REITs will result in reaching a market with more competition and lower expense ratios. I charted the expense ratios for the four ETFs below. The expense ratio drains money away from the investor each year and results in a lower CAGR (compound annual growth rate). Therefore, I see lower expense ratios as very favorable. I would prefer to see an expense ratio below .24%, but there are not many options to choose from. Bid-Ask Spreads Liquidity is a very real cost. When investors are going to buy an ETF, they will face the challenge of covering the bid-ask spread. It is true that they may use a limit order to avoid the bid-ask spread, but then the investor still faces execution uncertainty as their order might not trigger. If the order doesn’t trigger and the investor missed the opportunity to buy, they have missed out on the opportunity. When the bid-ask spread is smaller and liquidity is higher, it is more likely that the order will trigger (assuming it is set near the normal spread) and the investor will have a completed transaction. Therefore, I see a smaller spread as being advantageous. All else equal, I would be more inclined to buy into an ETF where the spread was smaller. While researching for this article I checked the spreads on each security. Keep in mind these are spreads at one point in time so they may fluctuate meaningfully from their average level. To make the spreads more indicative of the value lost due to a wider spread, I’m using spreads as a percentage of the share price rather than using the amount of cents in the spread. If an investor buys and sells frequently, a larger spread becomes more important than a larger expense ratio on the ETF. Holdings in China I’m bearish on the Chinese market because I believe the market has become too frothy as investors are able to access margins and bid up prices with money they don’t have. If the losses start and the domestic investors lose money, they may lose the purchasing power necessary to support the domestic companies. As a result, I would prefer international ETFs with a smaller allocation to China. I’m treating investments in Hong Kong as being separate, though I wouldn’t be surprised to see a strong correlation between the two and I would be happy to see lower levels of investment in Hong Kong. While the Vanguard Global ex-U.S. Real Estate ETF is offering investors the lowest expense ratios and best liquidity, it also offers the most exposure to China. Over 8% of the equity value is coming from China for VNQI, which is higher than any of the other ETFs. The other ETFs have all kept China out of their portfolio. In my opinion, the ideal investment in international REITs would more closely resemble VNQI on the first two metrics without having China as a meaningful weight in the portfolio. Since I’m concerned about a correlation between Hong Kong and the main Chinese market, I want to recognize the exposure to that market as well. VNQI performs the best on this metric with less than 11% in Hong Kong while RWX comes in right behind it with about 11.5%. For IFGL the exposure on Hong Kong is 17% and for WPS it is 15%. Conclusion I have to give the nod on portfolio holdings to RWX while crowning VNQI as the champ on the other metrics. IFGL and WPS both offer too much exposure to Hong Kong, too little liquidity, and too high of expense ratios. If an investor really wants to play with IFGL and WPS, it may be best to become very knowledgeable about them and use limit orders to prevent crossing the bid-ask spread. Disclosure: I am/we are long VNQI. (More…) I wrote this article myself, and it expresses my own opinions. I am not receiving compensation for it (other than from Seeking Alpha). I have no business relationship with any company whose stock is mentioned in this article. Additional disclosure: Information in this article represents the opinion of the analyst. All statements are represented as opinions, rather than facts, and should not be construed as advice to buy or sell a security. Ratings of “outperform” and “underperform” reflect the analyst’s estimation of a divergence between the market value for a security and the price that would be appropriate given the potential for risks and returns relative to other securities. The analyst does not know your particular objectives for returns or constraints upon investing. All investors are encouraged to do their own research before making any investment decision. Information is regularly obtained from Yahoo Finance, Google Finance, and SEC Database. If Yahoo, Google, or the SEC database contained faulty or old information it could be incorporated into my analysis.

Hedging The 10-Year? Consider DTYS

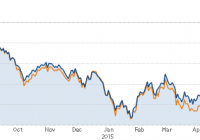
Summary DTYS provides a well correlated hedge for 10-year treasury bonds. DTYS, like most alternative investments, is associated with significant risks and is intended for achieving short term goals. Recommended for investors who believe interest rates will rise dramatically over an intermediate time frame. Basic Information The iPath U.S. Treasury 10-year Bear ETN (NASDAQ: DTYS ) is an exchange traded note (ETN). ETNs are unsecured, unsubordinated debt securities. This type of debt security differs from other types of bonds and notes because ETN returns are based upon the performance of a market index minus applicable fees, no period coupon payments are distributed and no principal protections exist. DTYS is intended to move inversely (-1x) to The Barclays Capital 10Y U.S. Treasury Futures Targeted Exposure index. The Barclay’s index is tied to U.S. treasury yields. DTYS seeks investment results for a single day only, not for longer periods. A “single day” is measured from the time the Fund calculates its net asset value (“NAV”) to the time of the Fund’s next NAV calculation. The return of the Fund for periods longer than a single day will be the result of each day’s returns compounded over the period, which will very likely differ from the inverse (-1x) of the return of The Barclays Capital 10Y U.S. Treasury Futures Targeted Exposure index for that period. For periods longer than a single day, the Fund will lose money when the level of the Index is flat, and it is possible that the Fund will lose money even if the level of the Index falls. Longer holding periods, higher index volatility, and inverse exposure each exacerbate the impact of compounding on an investor’s returns. During periods of higher Index volatility, the volatility of the Index may affect the Fund’s return as much as or more than the return of the Index. Expense Ratio: .75% + Portfolio turnover (currently 0% because cash instrument and derivative transactions are not included). How Could it be used? If you are looking for a 10-year hedge, DTYS could be a very beneficial to your portfolio. It is highly correlated to the market, and it is a useful tool any skilled investor should consider. In this article, I’ll attempt to illuminate the risks of investing in an ETN, but with adequate forethought DTYS is not a bad strategy, especially with the threat of rising interest rates. Principal Investment Strategy All investment strategies are used in combination to achieve similar daily return characteristics as -1x of the index: Derivatives – financial instruments whose value is derived from the value of an underlying asset or assets, such as stocks, bond, funds, interest rates, or indexes. Swap agreements – Contracts entered into primarily with major global financial institutions for a specified period ranging from a day to more than one year. In a standard “swap” transaction, two parties agree to exchange the return (or differentials in rates of return) earned or realized on particular predetermined investments or instruments. The gross return to be exchanged or “swapped” between the parties is calculated with respect to a “notional amount,” e.g., the return on or change in value of a particular dollar amount invested in a “basket” of securities or an ETF representing a particular index. Futures Contracts – Standardized contracts traded on, or subject to the rules of, an exchange that call for the future delivery of a specified quantity and type of asset at a specified time and place or, alternatively, may call for cash settlement. Money Market Instruments U.S. Treasury Bills – that have maturities of one year or less and supported by full faith and credit of the U.S. government. Repurchase Agreements – Contracts in which a seller of securities, usually U.S. government securities or other money market instruments, agrees to buy them back at a specified time and price. Repurchase agreements are primarily used by the Fund as a short-term investment vehicle for cash positions. These are the Principal Risks associated with TBX Risks Associated with the Use of Derivatives Compounding Risk Correlation Risk Fixed Income and Market Risk Counterparty Risk Debt Instrument Risk Interest Rate Risk Intraday Price Performance Risk Inverse Correlation Risk Liquidity Risk Early Close/Late Close/Trading Halt Risk Market Price Variance Risk Valuation Risk Non-Diversification Risk Portfolio Turnover Risk Short Sale Exposure Risk As you can see below, estimated returns are volatile, and the funds actual results may be significantly better or worse than the underlying index. Bolded values, not including the x and y axis percentages, are where the fund performed worse than expected. This is meant to illuminate the possibility of under or over performance. Theoretical Fund Returns Index Performance One Year Volatility Rate One Year Index Inverse (-1x) of the One Year Index 10% 25% 50% 75% 100% -60% 60% 147.50% 134.90 94.70 42.40 (8.00) -50% 50% 98.00 87.90 55.80 14.00 (26.40) -40% 40% 65.00 56.60 29.80 (5.00) (38.70) -30% 30% 41.40 34.20 11.30 (18.60) (47.40) -20% 20% 23.80 17.40 (2.60) (28.80) (54.00) -10% 10% 10.00 4.40 (13.50) (36.70) (59.10) 0% 0% (1.00) (6.10) (22.10) (43.00) (63.20) 10% -10% (10.00) (14.60) (29.20) (48.20) (66.60) 20% -20% (17.50) (21.70) (35.10) (52.50) (69.30) 30% -30% (13.80) (27.70) (10.10) (56.20) (71.70) 40% -40% (29.30) (32.90) (44.40) (59.30) (73.70) 50% -50% (34.00) (37.40) (48.10) (62.00) (75.50) 60% -60% (38.10) (41.30) (51.30) (64.40) (77.00) Correlation to 10-year yields I aligned DTYS with 10-year treasury yields. Essentially, DTYS is perfectly correlated to yields. Since bond prices react inversely to yields, it is easy to see why DTYS would be a good choice for hedging rising interest rates. Their are other alternative investment tools like the ProShares Short 7-10 Year Treasury ETF (NYSEARCA: TBX ) . DTYS, in my opinion. is the best direct tool for hedging rates. When rates spike, however, their are a number of other options to consider . My advice for any investor is to expose yourself only to risk you feel comfortable with. Conservative plays often pan out better than risky ones in the long run. DTYS is certainly a risky investment with potential for mediocre to negative returns. Conclusion If you are trying to hedge your investment on 10-Year Treasury yields, then DTYS is probably an ETN you ought to consider. However, it is important for any smart investor to weigh the risks associated with any ETN before jumping into any investment long or short. Disclosure: I/we have no positions in any stocks mentioned, and no plans to initiate any positions within the next 72 hours. (More…) I wrote this article myself, and it expresses my own opinions. I am not receiving compensation for it (other than from Seeking Alpha). I have no business relationship with any company whose stock is mentioned in this article.