Scalper1 News
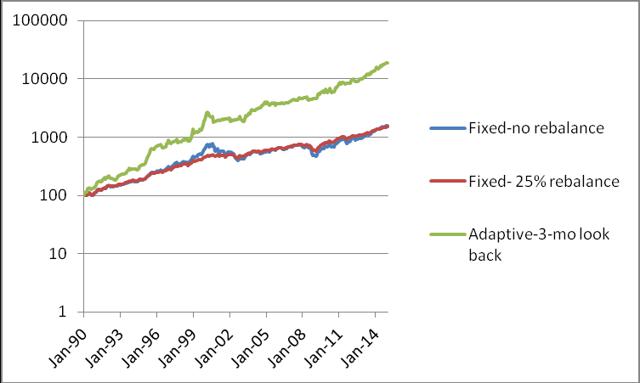
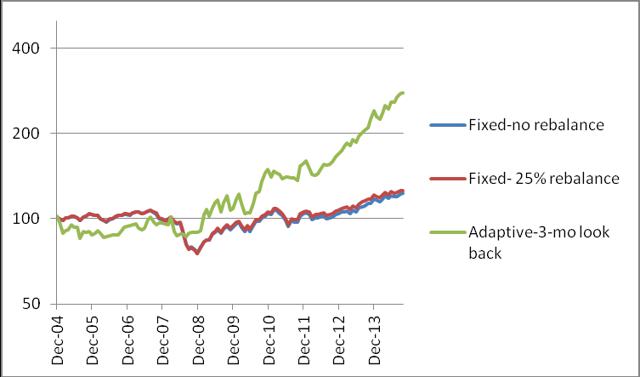 Summary Robust investment portfolios with large withdrawal rates can be constructed with Fidelity select mutual funds. From January 1990 to December 2014, a Fidelity portfolio with fixed allocation allowed a safe 6% annual withdrawal rate and achieved 6.19% annual increase of the capital. Same portfolio with rebalancing at 25% deviation from the target allowed a safe 6% annual withdrawal rate and achieved 7.78% compound annual increase of the capital. Radically better performance is achieved using adaptive asset allocation. Same portfolio allowed a safe 6% annual withdrawal rate and 22.05% annual increase of the capital. The Chicago South Suburban Investment Club has been experimenting with a monthly asset rotation strategy applied to a hypothetic IRA account using five Fidelity mutual funds. On the last trading day of each month, the funds are ranked by the previous 3-month return. All equity is invested in the fund with the highest return, as long as that return is positive. If all the assets had negative returns over the previous 3 months, then all equity is moved into CASH. The five mutual funds considered for investment are the following: Fidelity GNMA (MUTF: FGMNX ) Fidelity Select Multimedia (MUTF: FBMPX ) Fidelity Select Chemicals (MUTF: FSCHX ) Fidelity Select Electronics (MUTF: FSELX ) Fidelity Select Health Care (MUTF: FSHCX ) This experiment has been ongoing since July 2014. It extends over a period of 5 months. Within this time interval, the system had been invested 4 months in FSPHX, 1 month in FSELX, and current month in FLBIX. The results are showed in the table below. Table 1. Momentum allocation portfolio August 2014 to January 2015 Month AUG SEP OCT NOV DEC JAN ETF FSPHX FSPHX FSPHX FSPHX FSELX FLBIX BUY 206.52 218.7 218.92 228.7 81.43 13.32 SELL 218.7 218.92 228.7 236.08 84.78 RETURN 5.90 0.10 4.47 3.23 4.11 EQUITY 100.00 105.90 106.00 110.74 114.31 119.02 In this article, three different strategies will be considered: (1) Portfolio is initially invested 50% in the bond fund , and 12.5% each in the four equity funds without rebalancing. (2) Portfolio is initially invested 50% in the bond fund , and 12.5% each in the four equity funds but is rebalanced when the allocation to any fund deviates by 25% from its target. (3) Portfolio is at all times invested 100% in only one fund. The switching, if necessary, is done monthly at closing of the last trading day of the month. All money is invested in the fund with the highest return over the previous 3 months. The data for the study were downloaded from Yahoo Finance on the Historical Prices menu for the five tickers, FGMNX, FBMPX, FSCHX, FSELX, FSPHX. We use the monthly price data from January 1990 to December 2014, adjusted for dividend payments. The purpose of this exercise is to develop a robust strategy for income generation in retirement. The paper is made up of two parts. In part I, we examine the performance of portfolios without any income withdrawal. In part II, we examine the performance of portfolios when income is extracted periodically from the account. Part I : Portfolios without withdrawals In table 2 we show the results of the portfolios managed for 25 years, from January 1990 to December 2014. Table 2. Portfolios without withdrawals 1990 – 2014. Strategy Total return% CAGR% Number trades MaxDD% Fixed-no rebalance 1,463 11.62 0 -49.21 Fixed-25% rebalance 1,395 11.43 28 -22.55 Adaptive 18,015 23.35 126 -33.11 The time evolution of the equity in the portfolios is shown in Figure 1. (click to enlarge) Figure 1. Equities of portfolios without withdrawals. Source: This chart is based on EXCEL calculations using the adjusted monthly closing share prices of securities. Notice that the prices are shown in a logarithmic scale. That allows a better differentiation between the curves. It is apparent that the rate of increase of the adaptive portfolio is very stable and is substantially greater than the rate of the fixed allocation portfolios. One can also see that rebalancing of the fixed allocation portfolio makes its rate of increase much more stable than that of the portfolio without rebalancing. Part II: : Portfolios with withdrawals Assume that we have $1,000,000 to invest for income in retirement. In table 2 we show the results of the portfolios managed for 10 years, from January 2005 to December 2014. Money was withdrawn monthly at a 6% annual rate of the initial investment plus a 2% inflation adjustment. Over the 10 years from January 2005 to December 2014, a total of $664,704 was withdrawn. Table 3. Portfolios with 6% annual withdrawal rate 2005 – 2014. Strategy Total return% CAGR% Number trades MaxDD% Fixed-no rebalance 122.63 2.06 0 -28.82 Fixed-25% rebalance 125.76 2.32 5 -30.11 Adaptive 278.92 10.8 56 -15.92 The time evolution of the equity in the portfolios is shown in Figure 2. (click to enlarge) Figure 2. Equities of portfolios with 6% annual withdrawal rates. Source: This chart is based on EXCEL calculations using the adjusted monthly closing share prices of securities. Conclusion The adaptive allocation algorithm performed substantially better than the fixed allocation algorithms. The fixed allocation strategies allow a safe withdrawal rate of 6% at any time horizon between 1990 and 2014, without a substantial decrease of capital. The adaptive allocation algorithm allows a 6% annual withdrawal rate while assuring a substantial increase of capital. In fact, the momentum-based adaptive allocation strategy allows a safe 10% annual rate of withdrawal without any decrease of capital. Scalper1 News
Scalper1 News