Scalper1 News
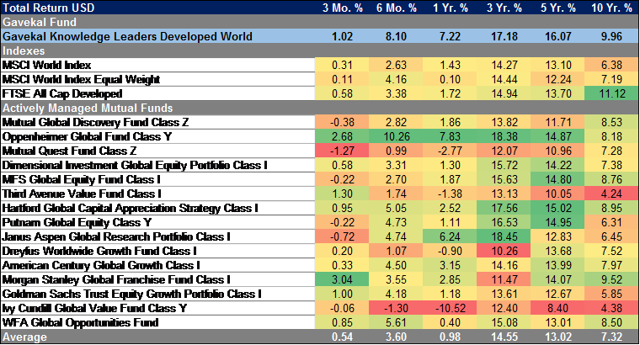
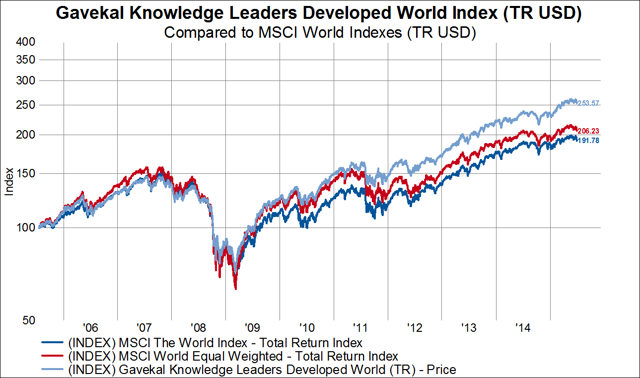
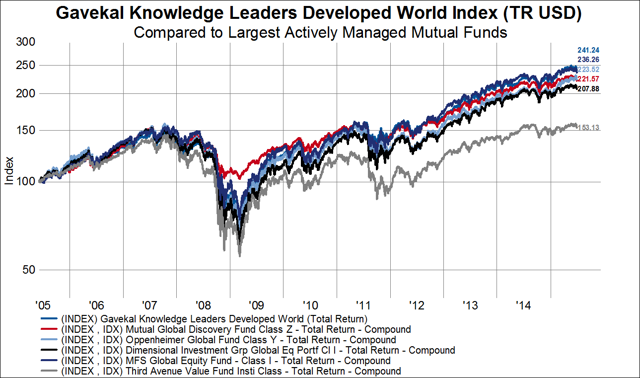
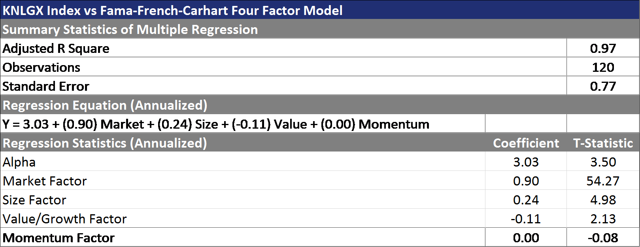
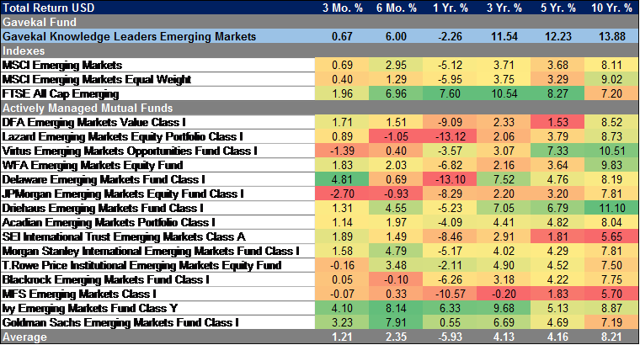
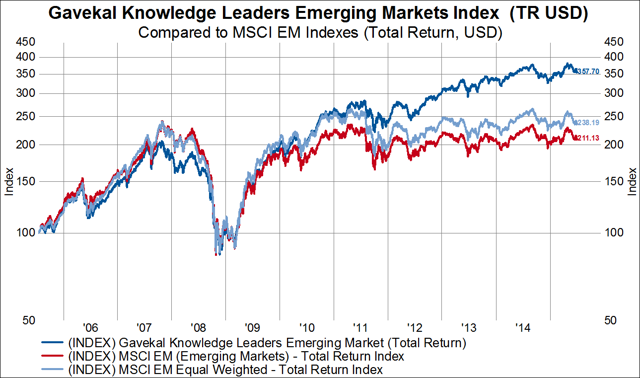
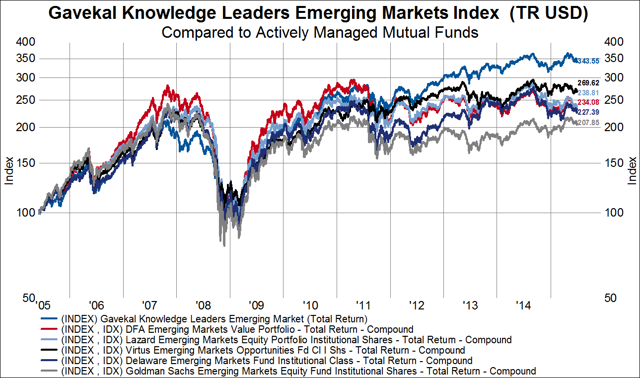
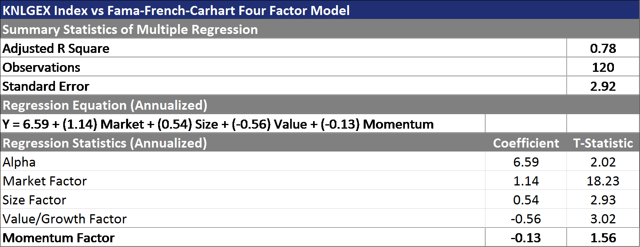
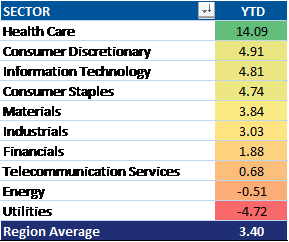
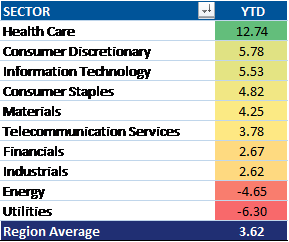
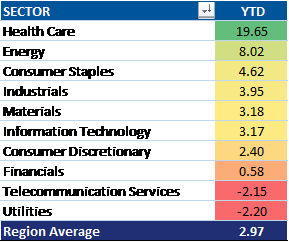
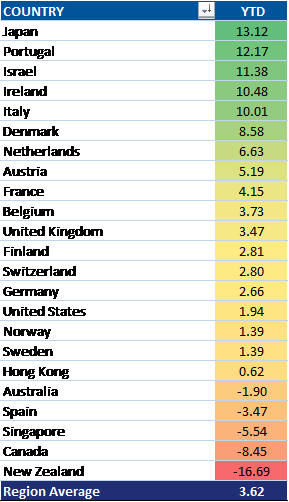
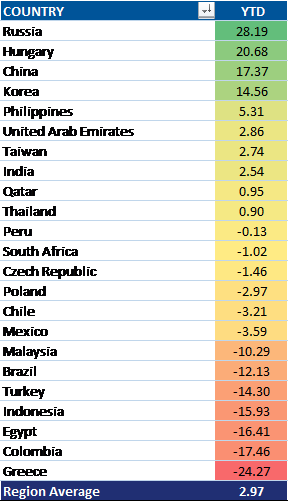
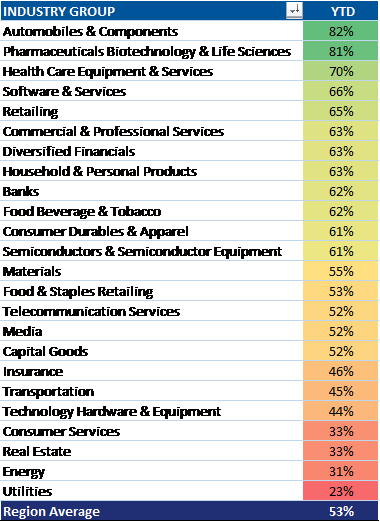
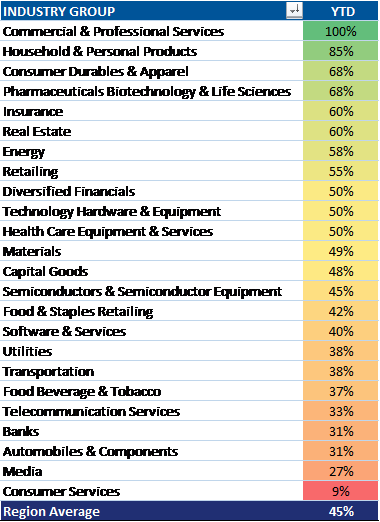
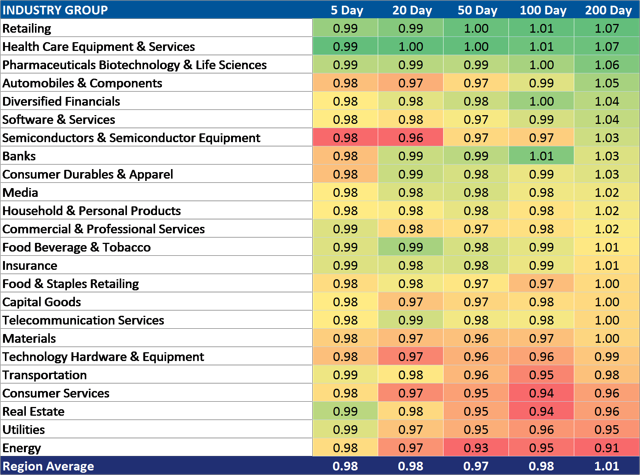
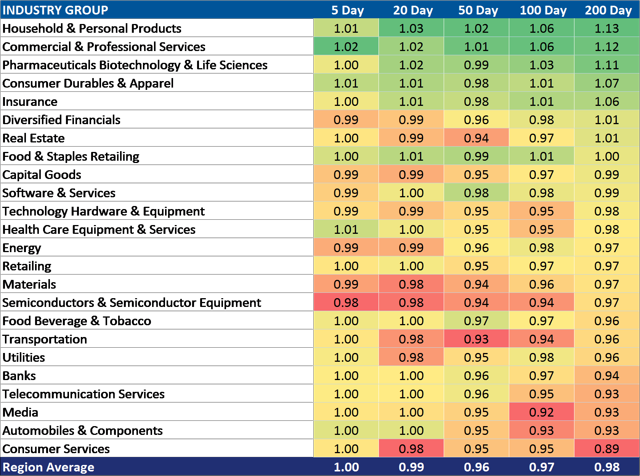
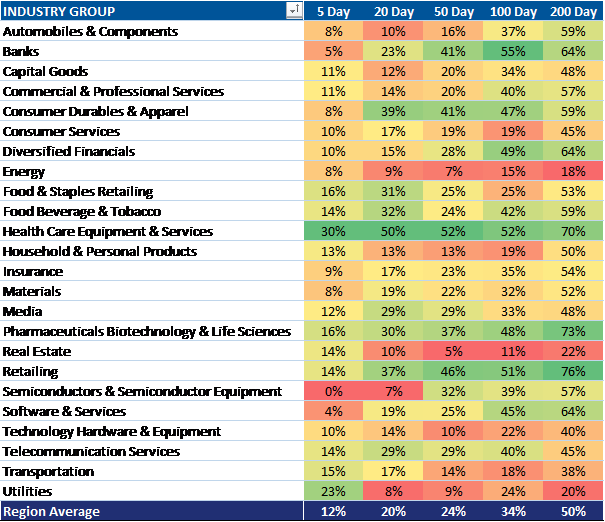
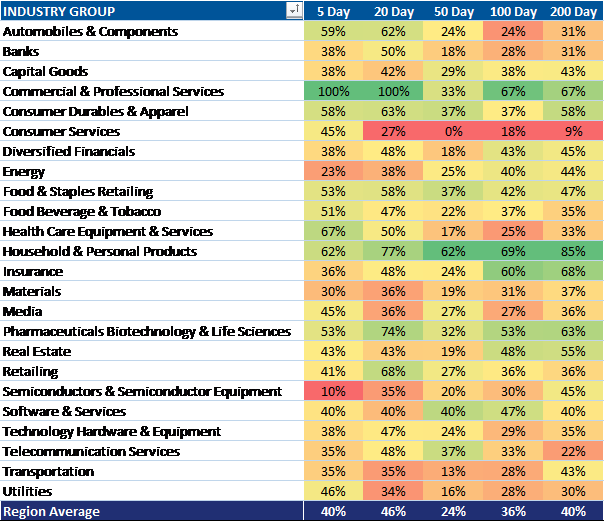
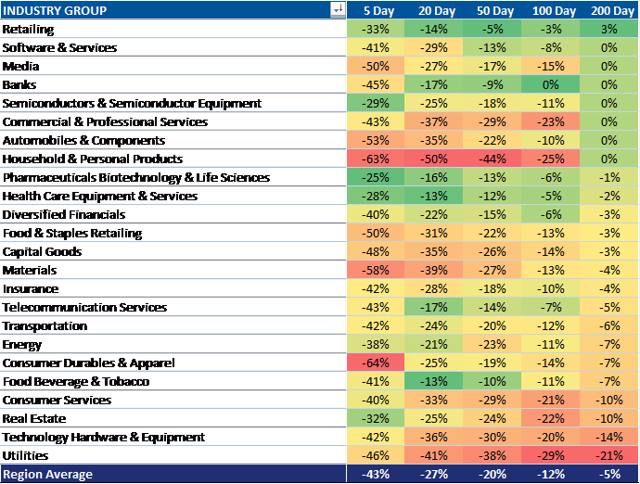
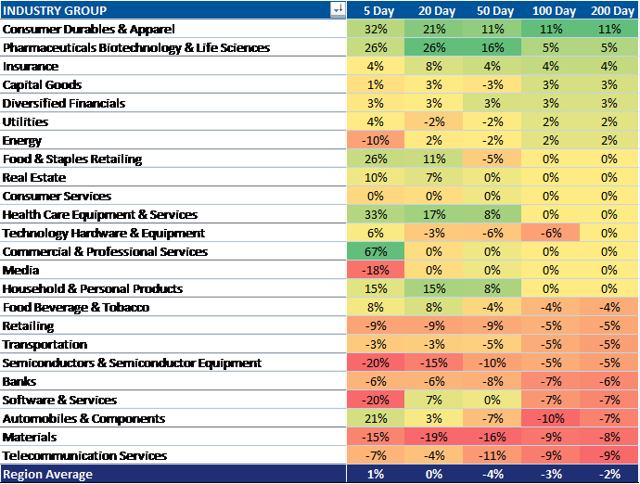
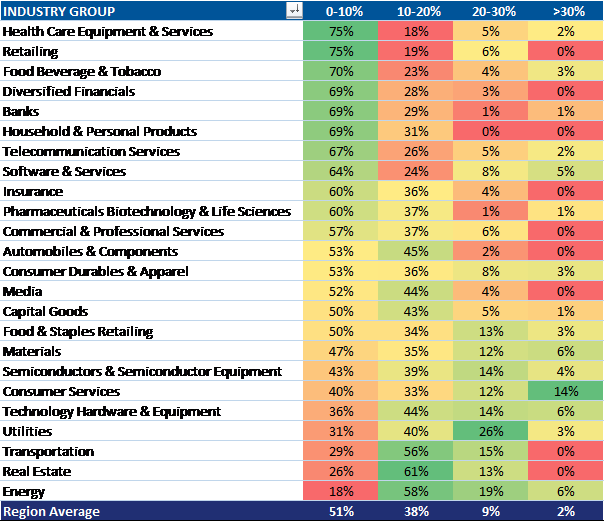
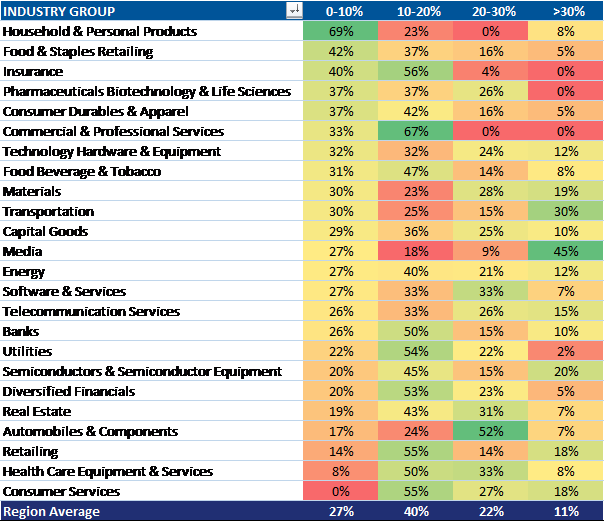
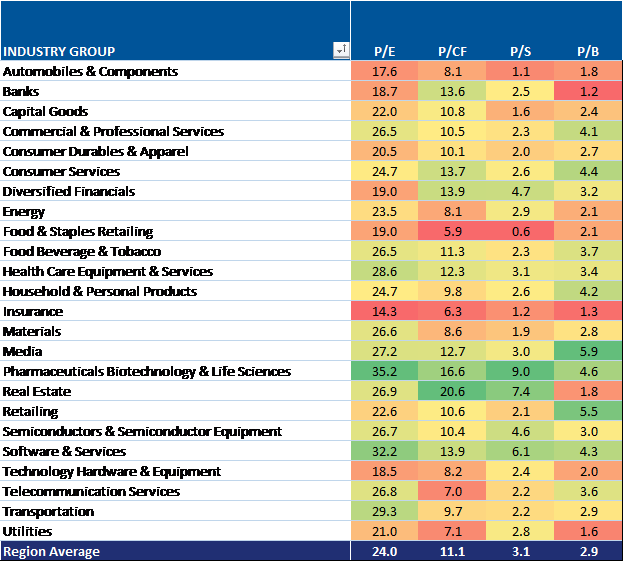
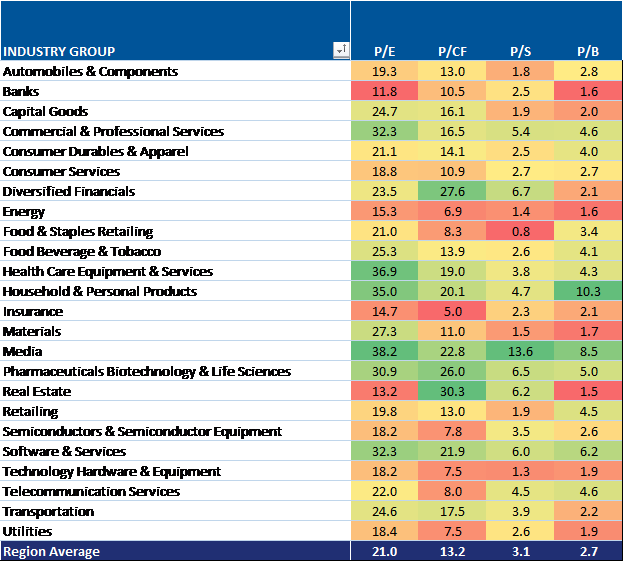
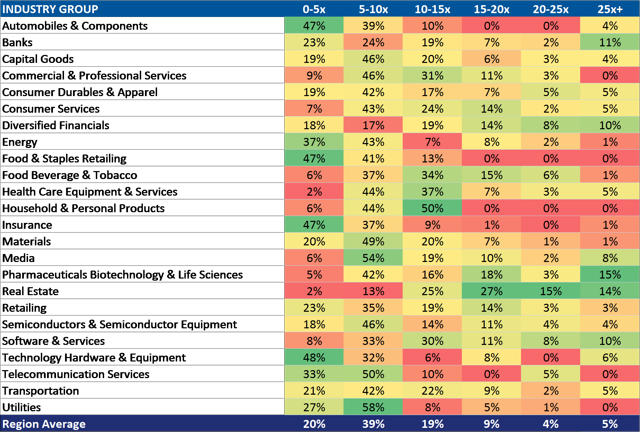
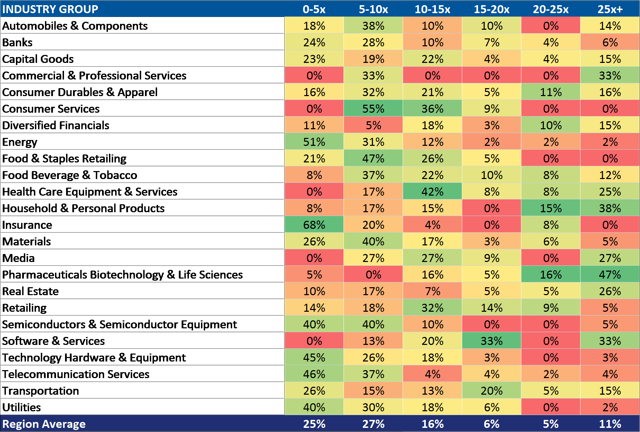
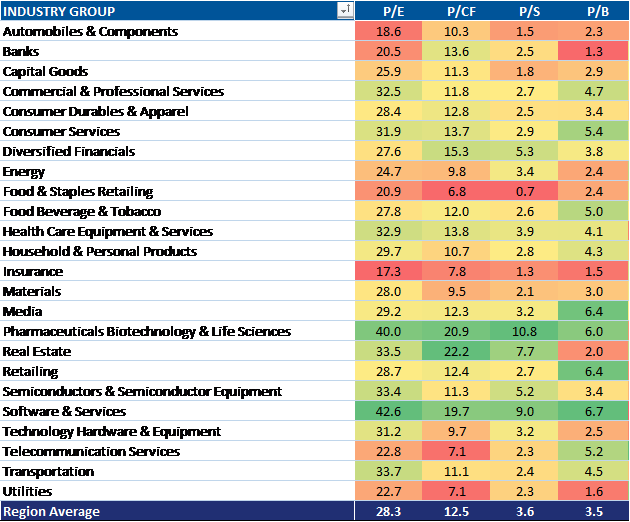
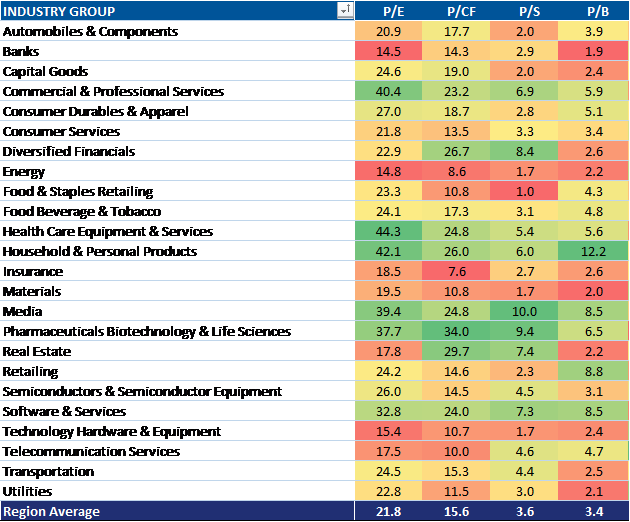
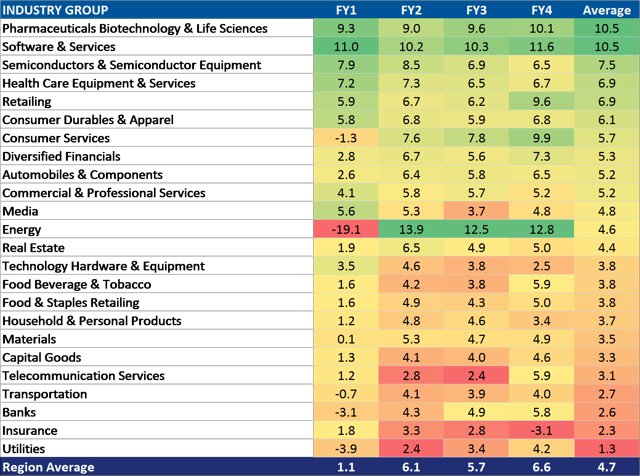
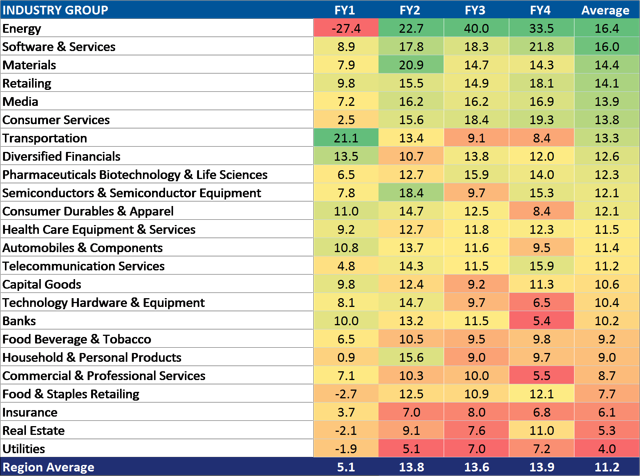
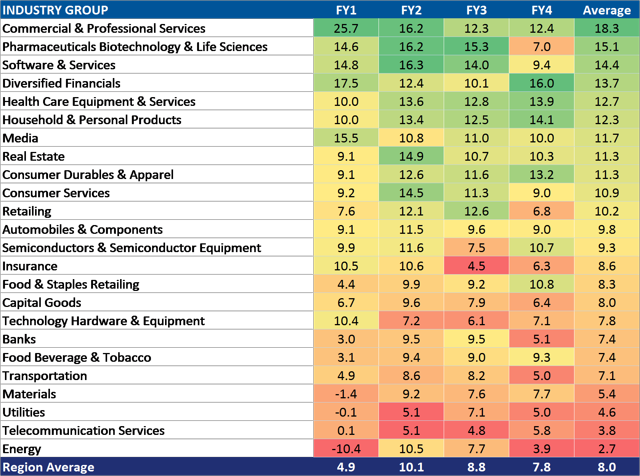
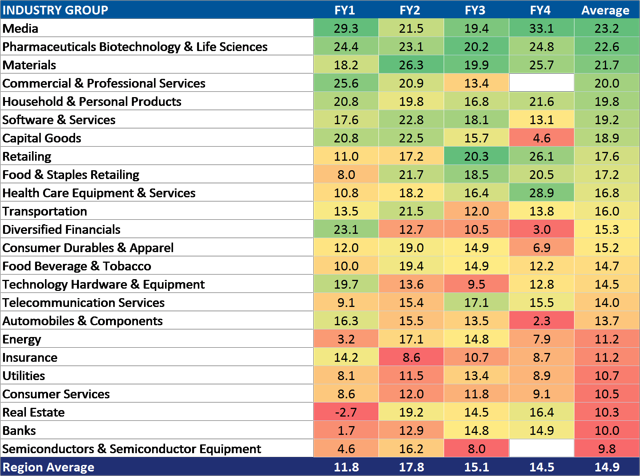
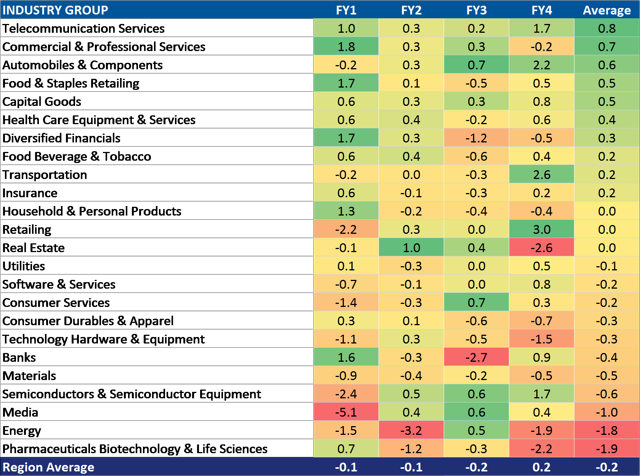
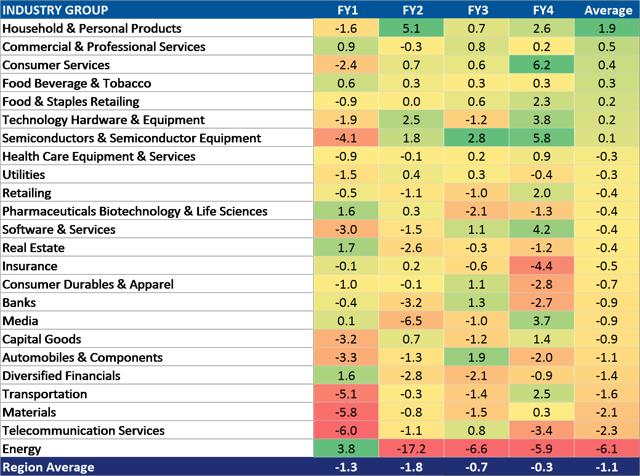
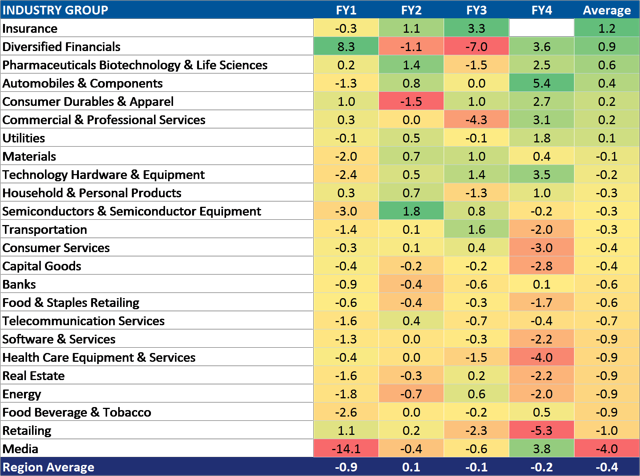
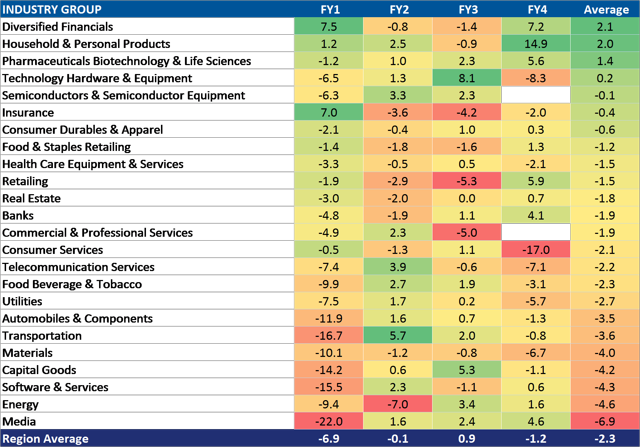
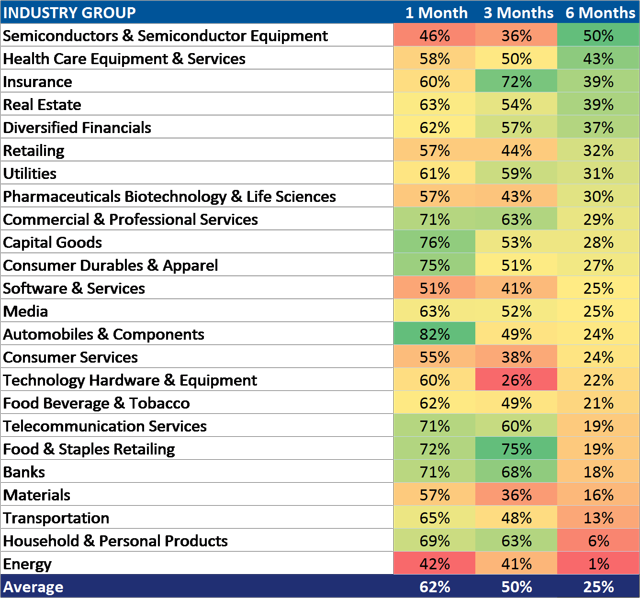
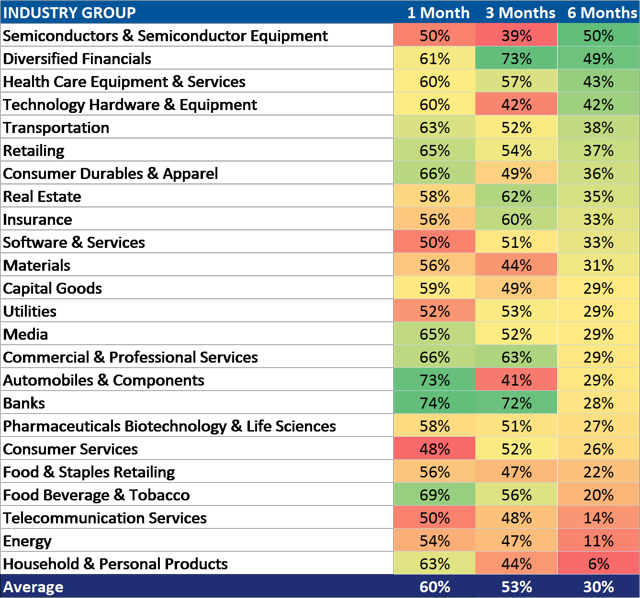
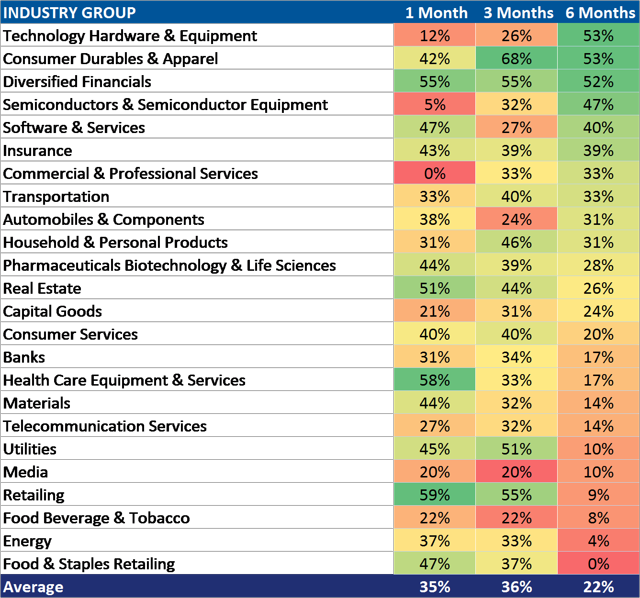
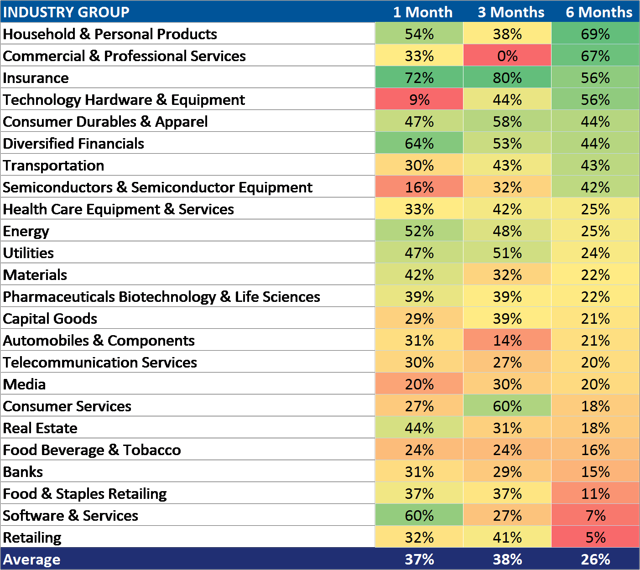
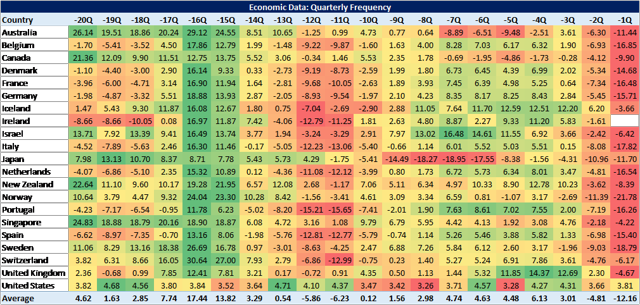
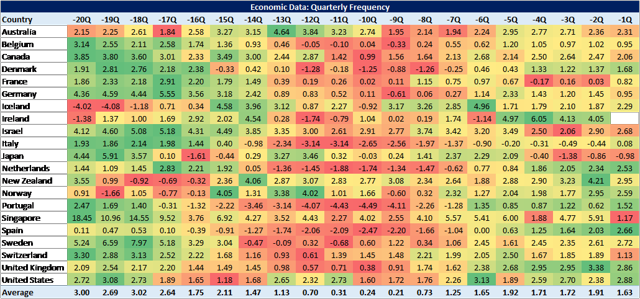
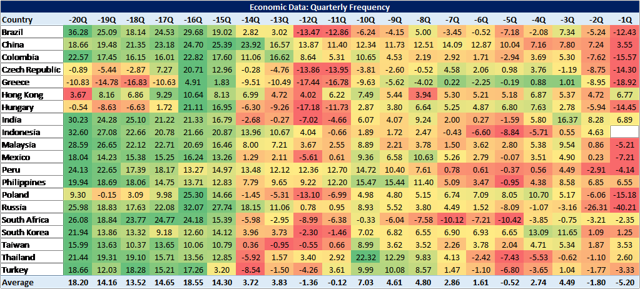
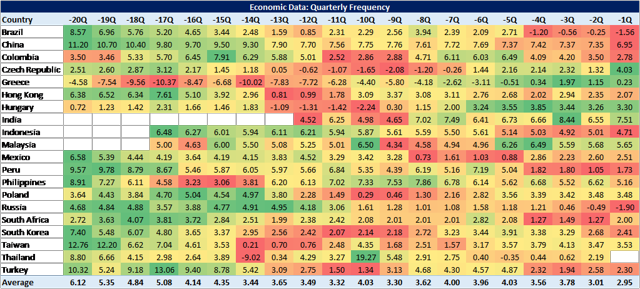
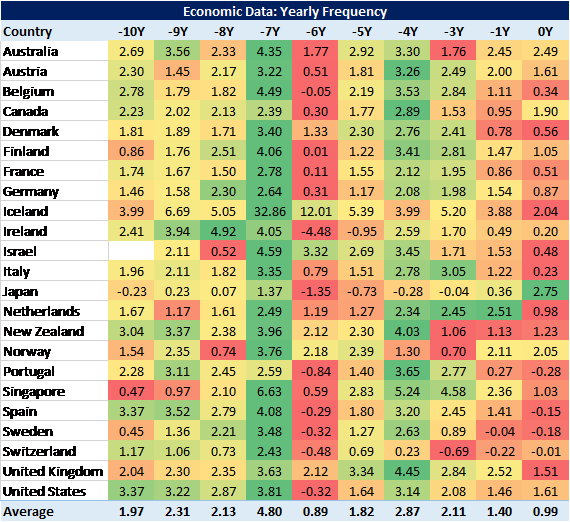

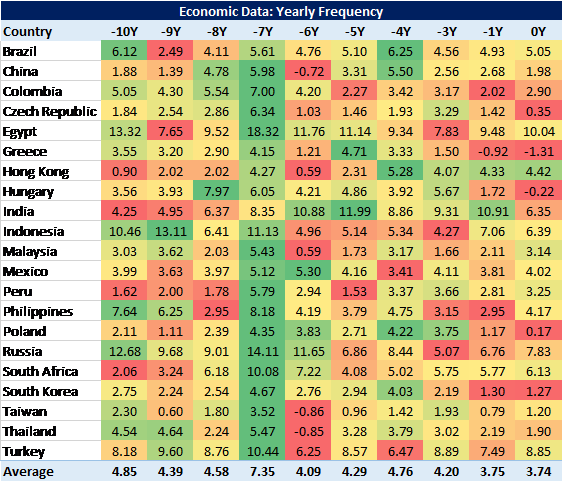
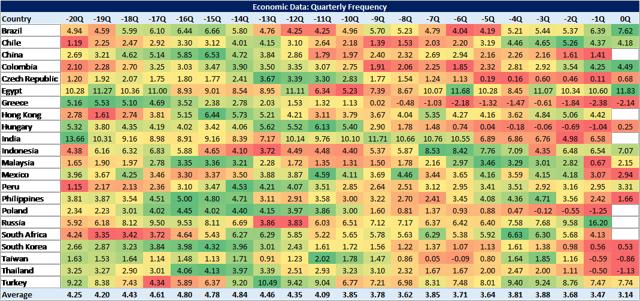
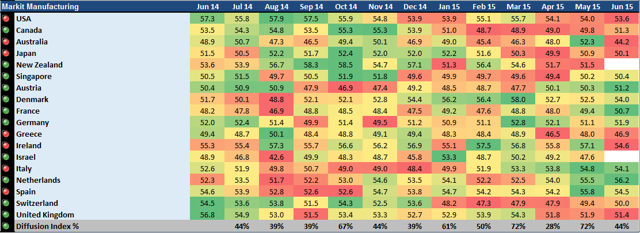
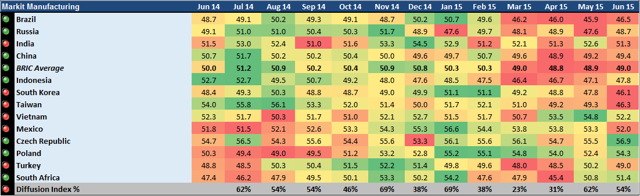
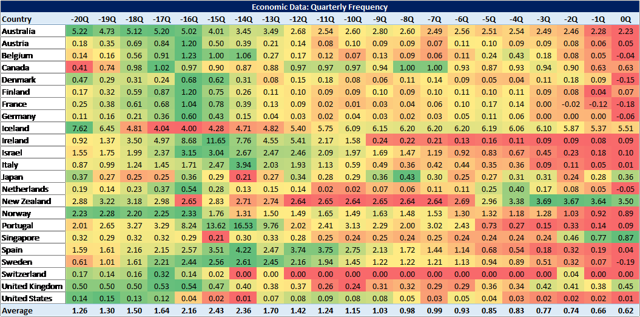
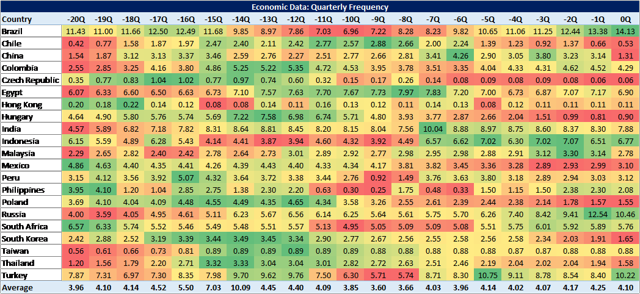
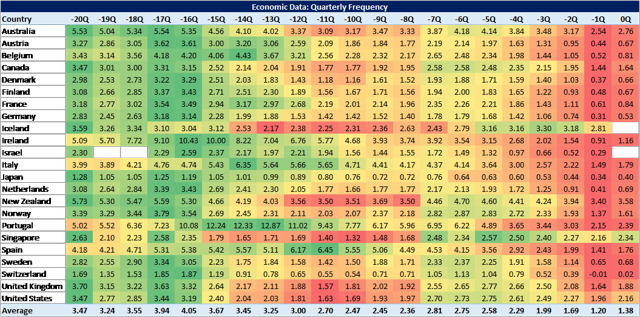
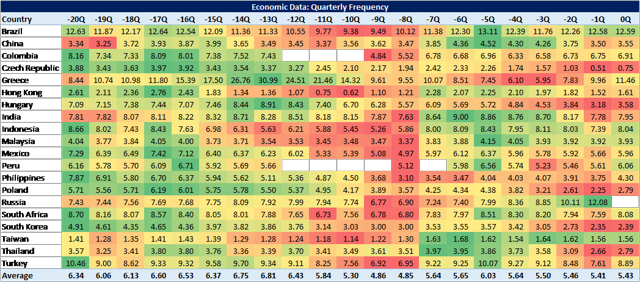
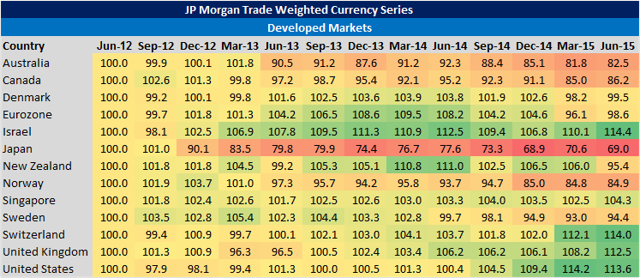
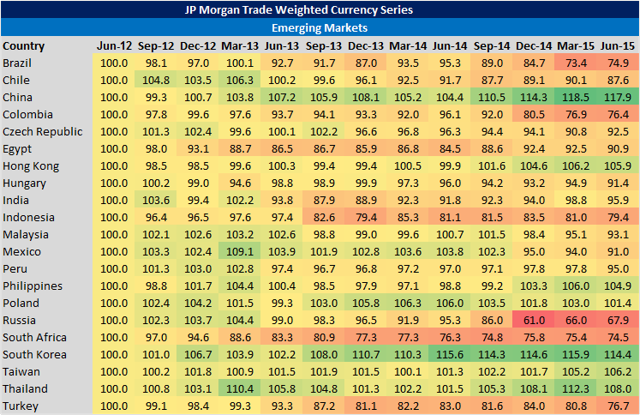
 Summary This quarter, we check in on the results of our strategic beta indexes and compare them to the results of the largest actively managed funds in their Morningstar categories. Before now, only actively managed mutual funds held the promise of excess returns. But good actively managed funds can be expensive, difficult to identify and are subject to manager risk. Strategic beta products are a disruptive technology, ideally suited for investors looking to improve portfolios because they aim to capture excess returns in a cheaper, simpler and more predictable way. We also offer charts and commentary on the equity and fixed income markets, commodities, currencies and economic indicators. We’re pleased to present our first quarterly commentary. As a data driven firm, we spend significant time working with data, from sourcing to scrubbing it to identify Knowledge Leaders, to thinking of creative ways to present it in such a way as to improve our chances of identifying trends. Each quarter, in this report, we will offer commentary on our indexes, the equity and fixed income markets, commodities, currencies and economic indicators. We begin with the results of our strategic beta indexes and compare them to results of the largest actively managed funds in the Morningstar World Stock and Diversified Emerging Markets categories. Before now, only actively managed mutual funds held the promise of excess returns. But good actively managed funds can be expensive, difficult to identify and are always subject to manager risk. We believe strategic beta products are a disruptive technology, ideally suited for investors looking to improve portfolio performance, efficiency and cost. Strategic beta products aim to capture excess returns in a cheaper, simpler and more predictable way. Gavekal Knowledge Leaders Indexes Commentary The Gavekal Knowledge Leaders Developed World Index was up 1.02% over the last three months. This performance compares favorably to the 0.31% increase experienced by the MSCI World Index and the 0.11% increase experienced by the MSCI World Equal Weight Index. Over the last year, the Gavekal Knowledge Leaders Developed World Index was up 7.22%. The MSCI World Index was up 1.43% over this period, and the MSCI World Equal Weight Index was up 0.10%. The ten year annualized total return of the Gavekal Knowledge Leaders Developed World Index is 9.96% compared to the MSCI World Index which achieved a ten year annualized total return of 6.38%. Only three of the fifteen largest actively managed mutual funds in the Morningstar World Stock category outperformed our index over the last three months. Over the last year, the average performance of the top 15 actively managed mutual funds is 0.98% compared to the 7.22% increase in the Gavekal Knowledge Leaders Developed World Index. Our ten year annualized total return is 9.96% compared to the best actively managed mutual fund (Morgan Stanley Global Franchise Fund) which was up 9.52%. Exhibit 1: Total Returns of Developed World Indexes and the Largest Actively Managed Mutual Funds (click to enlarge) As of 6/30/2015. Sources: MSCI, Gavekal Capital Exhibit 2: Total Return of Gavekal Knowledge Leaders Developed World Index Compared to MSCI World Indexes (click to enlarge) As of 6/30/2015. Source: Gavekal Capital Exhibit 3: Total Return of Gavekal Knowledge Leaders Developed World Index Compared to MSCI World Indexes (click to enlarge) As of 6/30/2015. Source: Gavekal Capital The Gavekal Knowledge Leaders Developed World Index has generated a statistically significant, multi-dimensional alpha since inception (April 1, 2000). The basic Fama-French-Carhart Four Factor Model explains roughly 97% of the returns of our index. The Gavekal Knowledge Leaders Developed World Index generated a 3.03% alpha, with a t-stat of 3.5 (above 2.0 indicates statistically significant variable). Our index has less exposure to the market, with a coefficient of 0.9. We have a slight tilt toward smaller cap stocks because our index is equal weighted, but with a coefficient of 0.24 the tilt is not large. We have a slight tilt away from value, with a negative 0.11 coefficient. The coefficient to the momentum factor is zero and the t-stat falls below the critical 2.0. This suggests the index has no momentum factor exposure at all. Exhibit 4: Fama-French-Carhart 4 Factor Regression of Gavekal Knowledge Leaders Developed World Index, 10 Years (click to enlarge) As of 6/30/2015. Sources: MSCI, Gavekal Capital The Gavekal Knowledge Leaders Emerging Markets Index (KNLGEX) was up 0.67% over the last three months. The MSCI Emerging Markets Index (MSCI EM) was up 0.69% and the MSCI Emerging Markets Equal Weight Index (MSCI EM Equal) was up 0.4% over the last three months. The MSCI EM and MSCI EM Equal Weight Index were down 5.12% and 5.95%, respectively, over the last year. The KNLGEX Index fell half as much, down 2.26% over the last year. Since inception (4/1/2010) the KNLGEX Index is up 13.88% on an annualized rate. This compares to the MSCI EM Index which is up 8.11% and the MSCI EM Equal Weight Index which is up 9.02% over the last ten years, at an annualized rate. Over the last three months, the average of the fifteen largest actively managed mutual funds in the Morningstar Diversified Emerging Markets category was +1.21%, beating the KNLGEX by almost 60bps. Over the last year, however, the KNLGEX is down -2.26% while the average of the largest actively managed mutual funds was down -5.93%. Since our index’s inception in 2005, none of the largest actively managed mutual funds have outperformed the KNLGEX Index. The best of the largest actively managed mutual funds (Driehaus Emerging Markets Fund, Class I) experienced a ten-year annualized total return of 11.1% while the average of the largest actively managed mutual funds was an increase of 8.21%. The KNLGEX Index has generated a total return of 13.88% since inception. Exhibit 5: Total Returns of Emerging Markets Indexes and the Largest Actively Managed Mutual Funds (click to enlarge) As of 6/30/2015. Sources: MSCI, Gavekal Capital Exhibit 6: Total Return of Gavekal Knowledge Leaders Emerging Markets Index Compared to MSCI Emerging Market Indexes (click to enlarge) As of 6/30/2015. Source: Gavekal Capital Exhibit 7: Total Return of Gavekal Knowledge Leaders Emerging Markets Index Compared to Largest Actively Managed Mutual Funds (click to enlarge) As of 6/30/2015. Source: Gavekal Capital The Gavekal Knowledge Leaders Emerging Markets Index has generated a statistically significant, multi-dimensional alpha since inception (April 1, 2000). The basic Fama-French-Carhart Four Factor Model explains roughly 78% of the returns of our index. The KNLGEX Index generated a 6.59% alpha, with a t-stat of 2.02 (above 2.0 indicates statistically significant variable). Our index has somewhat more exposure to the market, with a coefficient of 1.14. We have a tilt toward smaller cap with a coefficient of 0.54. We have a tilt away from value, with a negative -0.56 coefficient. The coefficient to the momentum factor is -0.13 and the t-stat falls below the critical 2.0. This suggests the index has no momentum factor exposure at all. Exhibit 8: Fama-French-Carhart 4 Factor Regression of Gavekal Knowledge Leaders Emerging Markets Index, 10 Years (click to enlarge) As of 6/30/2015. Sources: MSCI, Gavekal Capital Equity Markets Commentary Over the last four years, health care has been the best performing sector in the MSCI All Country World Index, up 130% on average, compared to the second best performer, consumer discretionary, up 84% on average. Energy has been the worst performing sector, down 9% over the last four years. Current performance trends are consistent with these well-established long-term trends. Our investment strategy has been tilted toward the growth counter-cyclical health care sector over the last few years. On average, sectors in the MSCI ACWI have gained 3.40% this year. Year-to-date, the health care sector is far and away the best performer-up almost three times more than the next best sector, consumer discretionary. Unsurprisingly, the utilities sector has fallen the most so far in 2015 as interest rates have begun slowly creeping higher. (Charts are conditionally formatted. Green indicates highest values and red represents lowest values.) Exhibit 9: Performance of MSCI All Country World Index by Sector, Equal Weight in USD As of 6/30/2015. Sources: MSCI, Gavekal Capital Developed world sectors have increased an average of 3.6% year-to-date, with health care in the lead once again (though by a slightly less impressive margin than in the ACWI). In the developed region, energy companies have fallen 4.6% since the beginning of the year-second only to the 6.30% decline in the utilities sector. Exhibit 10: Performance of MSCI Developed World Index by Sector, Equal Weight in USD As of 6/30/2015. Sources: MSCI, Gavekal Capital Emerging markets have underperformed developed markets year-to-date. Among emerging market sectors, health care stands out again with an even more impressive gain so far this year-almost 20%. Unlike in the developed market and the ACWI, emerging market energy sector companies have performed more positively, gaining more than 8% year-to-date. The only two sectors underperforming in the MSCI EM Index since the beginning of the year are telecommunications services (-2.15%) and utilities (-2.20%). Exhibit 11: Performance of MSCI Emerging Markets Index by Sector, Equal Weight in USD As of 6/30/2015. Sources: MSCI, Gavekal Capital Japan leads developed market countries in performance year-to-date, with Portugal, Israel, Ireland, and Italy rounding out the top five-all of which are up more than 10% so far this year. The majority of developed market countries are in positive territory since the beginning of the year, up an average of about 3.6%. While Canadian constituents have had a rough first half of 2015 (falling more than 8%), New Zealand companies have performed the worst, down more than 16%. Exhibit 12: Performance of MSCI Developed World Countries, Equal Weight in USD As of 6/30/2015. Sources: MSCI, Gavekal Capital There is an even wider dispersion in performance year-to-date among emerging market companies. In the MSCI Emerging Markets Index, the average Russian and Hungarian company is up over 20% so far this year while Greek companies, in aggregate, are firmly in a bear market (-24%). About half of the countries in emerging markets have gained so far this year, helping keep the overall average slightly positive (~3%). Exhibit 13: Performance of MSCI Emerging Markets Countries, Equal Weight in USD As of 6/30/2015. Sources: MSCI, Gavekal Capital Relative to the MSCI World Index, more than 80% of companies in the automobiles and components industry as well as the pharmaceutical, biotechnology and life sciences industry are outperforming YTD. Medical equipment and software have also broadly outperformed. At the other end of the spectrum, the utilities industry has just 23% of companies that are outperforming the benchmark year-to-date. Energy and real estate have been broadly hit with interest rates rising. Exhibit 14: Percent Outperforming MSCI World Index YTD, MSCI Developed World by Industry Group, Equal Weight in USD As of 6/30/2015. Sources: MSCI, Gavekal Capital According to the MSCI Emerging Markets Index and the MSCI World Index, every single company in the emerging markets’ commercial and professional services industry is outperforming the MSCI World Index so far this year-a significant difference from the 9% of consumer services companies that are outperforming the benchmark. On average, 45% of companies in the emerging markets have outperformed the MSCI World in the first half of 2015. There are numerous industry groups where less than 50% of the members have outperformed the MSCI World Index YTD, speaking to the difficulty of picking stocks in the emerging markets this year. Exhibit 15: Percent Outperforming MSCI World Index YTD, MSCI Emerging Markets by Industry Group, Equal Weight in USD As of 6/30/2015. Sources: MSCI, Gavekal Capital Leadership trends have been pretty stable in the developed world over the last 200 days, with health care, consumer discretionary and technology related industry groups holding above moving averages. Energy and utility related industry groups have consistently held below moving averages. Exhibit 16: Price Relative to Moving Average MSCI Developed World by Industry Group, Equal Weight (click to enlarge) As of 6/30/2015. Sources: MSCI, Gavekal Capital In the emerging markets, consumer and health care related industry groups have been, and remain, the strongest performers, holding above moving averages. Exhibit 17: Price Relative to Moving Average MSCI Emerging Markets by Industry Group, Equal Weight (click to enlarge) As of 6/30/2015. Sources: MSCI, Gavekal Capital Overall, price breadth in developed world stocks is on the decline. While half of all developed world stocks are trading above the 200-day moving average, only 24% are trading above the 50-day moving average. In 15 out of the 24 industry groups, a majority of stocks are trading above the 200-day moving average with retailing leading the way with 76% of the stocks trading above the 200-day moving average. Health care equipment and services currently has 52% of stocks trading above the 50-day moving average. Exhibit 18: Percent Above Moving Average MSCI Developed World by Industry Group, Equal Weight As of 6/30/2015. Sources: MSCI, Gavekal Capital Longer term breadth in emerging market stocks is worse than it is in the developed world. Only 40% of emerging market equities are trading above the 200-day moving average and 24% are trading above the 50-day moving average. The household and personal product industry really stands out in the emerging market with 85% of its stocks trading above the 200-day moving average and 62% trading above the 50-day moving average. This is by far the industry with the most stocks trading above the 50-day moving average. Exhibit 19: Percent Above Moving Average MSCI Emerging Markets by Industry Group, Equal Weight As of 6/30/2015. Sources: MSCI, Gavekal Capital Even in the developed world industry group with the most 200-day net new highs, retailing, only 3% of stocks are making net new 200-day highs. There are, on average, -5% net new highs over the last 200 days. This weak reading is symptomatic of a tired stock market that lacks vigor. New highs have been deteriorating at an accelerating rate recently. Exhibit 20: Net New Highs MSCI Developed World by Industry Group, Equal Weight (click to enlarge) As of 6/30/2015. Sources: MSCI, Gavekal Capital The internal dynamics of the emerging markets look somewhat more constructive. While -2% are making net new highs over the last 200 days, over the last 50 days, the reading is -0.4%. This compares with -20% in the developed markets. Exhibit 21: Net New Highs MSCI Emerging Markets by Industry Group, Equal Weight (click to enlarge) As of 6/30/2015. Sources: MSCI, Gavekal Capital Over half of stocks in the developed world are down less than 10% from 6 month highs, while only 2% are down over 30%. Thirty-eight percent of stocks are down in between a correction (-10%) and a bear market (-20%). Exhibit 22: Distance from 6 Month Highs MSCI Developed World by Industry Group, Equal Weight As of 6/30/2015. Sources: MSCI, Gavekal Capital The damage has been more extensive in the emerging markets over the last 6 months. Fully 73% of stocks in the emerging markets are in a technical correction, with 33% in a technical bear market. Exhibit 23: Distance From 6 Month Highs MSCI Emerging Markets by Industry Group, Equal Weight As of 6/30/2015. Sources: MSCI, Gavekal Capital Valuation multiples have expanded over the previous several years. No industry has a single digit average P/E, and few have a single digit price to cash flow multiple. This generalization holds across the emerging and developed worlds. Some value can still be found in the consumer non-cyclical, health care, technology and energy areas, but we feel the easy money from multiple expansion has more or less been made. As the tables below show, only 20% of DM companies and 27% of EM companies have a low single digit price to cash flow multiple. Bucking this trend are semiconductors, food and staples retailing and technology hardware, which may be areas of interest for new buys. In general, though, the level of valuations at this stage in the cycle complicates stock selection. Put another way, it’s becoming more and more difficult to find strong operating companies with a built-in margin of safety. Exhibit 24: Intangible Adjusted Valuations of MSCI Developed World Industry Groups, Equal Weight As of 6/30/2015. Sources: MSCI, Gavekal Capital Exhibit 25: Intangible Adjusted Valuations of MSCI Emerging Markets Industry Groups, Equal Weight As of 6/30/2015. Sources: MSCI, Gavekal Capital Roughly 59% of stocks sell for less than 10x intangible adjusted cash flow. There are pockets of value in the technology and consumer staples sectors. Exhibit 26: Intangible Adjusted Valuation Profile of MSCI Developed World Industry Groups, Equal Weight (click to enlarge) As of 6/30/2015. Sources: MSCI, Gavekal Capital In the emerging markets, fewer stocks are trading for less than 10x intangible adjusted cash flow. Roughly 52% of stocks are trading for less than 10x cash flow. Eleven percent of EM stocks sell for more than 25x intangible adjusted cash flow, more than twice the amount in the developed world. Exhibit 27: Intangible Adjusted Price/Cash Flow Profile of MSCI Emerging Markets Industry Groups, Equal Weight (click to enlarge) As of 6/30/2015. Sources: MSCI, Gavekal Capital Normalized valuations, looking at price relative to trailing 5-year fundamentals, are somewhat lofty across the board. Biotech and internet related industry groups are the most expensive areas of the market. No industry group is less than 1x book value, but banks are the cheapest at 1.3x. Exhibit 28: 5 Year Normalized Intangible Adjusted Valuations of MSCI Developed World Industry Groups, Equal Weight As of 6/30/2015. Sources: MSCI, Gavekal Capital Normalized valuations aren’t any more favorable, on average, in the emerging markets. Several industry groups are selling for more than 25x intangible adjusted normalized cash flow…a very rich level. Exhibit 29: 5 Year Normalized Intangible Adjusted Valuations of MSCI Emerging Markets Industry Groups, Equal Weight As of 6/30/2015. Sources: MSCI, Gavekal Capital The energy industry has the highest expected sales growth rate of the 24 industries in the table below for FY2-FY4 by several hundred basis points. Of course, part of this high expectation can be explained by the fact that the energy industry has had a collapse in growth expectations for FY1. Only two industries (software and services, and pharmaceuticals, biotechnology and life sciences) are expected to grow sales by 10% per year over the next four years. Exhibit 30: Sales Growth Estimates MSCI Developed World by Industry Group, Equal Weight (click to enlarge) As of 6/30/2015. Sources: MSCI, Gavekal Capital For the 24 industries, only seven industries are expected to grow earnings, on average, less than 10% a year for the next four years. There are incredibly high growth expectations in the next several years for the energy industry in the developed world. Analysts expect the energy industry to increase earnings by 22.7% in Fiscal Year (FY) 2, 40% in FY3, and 33.5% FY4. Exhibit 31: Earnings Growth Estimates MSCI Developed World by Industry Group, Equal Weight (click to enlarge) As of 6/30/2015. Sources: MSCI, Gavekal Capital In the emerging markets, growth expectations are much higher. Many of the 24 industry groups are expected to see sales grow by 10% per year, on average, over the next four years. Sales estimates across the 24 industries are expected to grow by 8% on average over the next four years with growth in FY2, at 10.1%, expected to be the highest growing year. Exhibit 32: Sales Growth Estimates MSCI Emerging Markets by Industry Group, Equal Weight (click to enlarge) As of 6/30/2015. Sources: MSCI, Gavekal Capital Four industries, media, pharmaceuticals, biotechnology and life sciences, materials, and commercial and professional services, are expected to average 20% earnings growth rates annually over the next four years. Exhibit 33: Earnings Growth Estimates MSCI Emerging Markets by Industry Group, Equal Weight (click to enlarge) As of 6/30/2015. Sources: MSCI, Gavekal Capital Overall, changes in sales growth estimates over the past three months have been relatively subdued as growth expectations have only declined by about 10-20 bps. Exhibit 34: 3 Month Revisions to Sales Growth MSCI Developed World by Industry Group, Equal Weight (click to enlarge) As of 6/30/2015. Sources: MSCI, Gavekal Capital Earnings growth estimates have declined at a greater rate as FY1 estimates have declined by 130 basis points and FY2 estimates have declined by 180 basis points over the past three months. Transportation, materials, and telecommunication services have dragged down FY1 earnings growth estimates while energy is almost entirely to blame for the large drop in FY2 estimates. Household and personal products is a bright spot for FY2 as earnings growth expectations have increased by over 5% over the past three months. Exhibit 35: 3 Month Revisions to Earnings Growth MSCI Developed World by Industry Group, Equal Weight (click to enlarge) As of 6/30/2015. Sources: MSCI, Gavekal Capital Sales growth estimates in the emerging markets have been hit a bit harder on average, especially for FY1 estimates, over the past three months. However, the drop is disproportionally due to the drop in media sales growth estimates. This has been partially offset by the large increase in FY1 sales growth estimates for diversified financials. Exhibit 36: 3 Month Revisions to Sales Growth MSCI Emerging Markets by Industry Group, Equal Weight (click to enlarge) As of 6/30/2015. Sources: MSCI, Gavekal Capital The decline in FY1 earnings estimates over the past three months has had much greater breadth. On average, FY1 earnings estimates have decreased by -6.9% with 21 out of the 24 industries experiencing declining FY1 estimates and six industries experiencing double-digit percentage declines in just three months. Exhibit 37: 3 Month Revisions to Earnings Growth MSCI Emerging Markets by Industry Group, Equal Weight (click to enlarge) As of 6/30/2015. Sources: MSCI, Gavekal Capital Sales revision breadth has generally been improving recently after being battered down six months ago. Only 25% of developed world stocks have had positive sales revisions over the past six months, however, 62% of developed world stocks have had positive sales revisions over the past one month. Exhibit 38: Sales Revision Breadth MSCI Developed World by Industry Group, Equal Weight (click to enlarge) As of 6/30/2015. Sources: MSCI, Gavekal Capital A similar story has played out with earnings revisions. Only 30% of world stocks have had positive earnings revisions over the past six months, however, 60% of world stocks have had positive earnings revisions over the past month. Exhibit 39: Earnings Revision Breadth MSCI Developed World by Industry Group, Equal Weight (click to enlarge) As of 6/30/2015. Sources: MSCI, Gavekal Capital Sales and earnings breadth is much weaker in the emerging markets. Less than 40% of all emerging markets stocks have experienced positive sales revisions over the past 1, 3, and 6 months. Exhibit 40: Sales Revision Breadth MSCI Emerging Markets by Industry Group, Equal Weight (click to enlarge) As of 6/30/2015. Sources: MSCI, Gavekal Capital The same story is true for earnings revisions during these time frames, with less than 40% of all emerging market stocks having experienced positive sales revisions over the past 1, 3, and 6 months. Exhibit 41: Earnings Revision Breadth MSCI Emerging Markets by Industry Group, Equal Weight (click to enlarge) As of 6/30/2015. Sources: MSCI, Gavekal Capital Economic, Fixed Income, Currency, Commodity Commentary Measuring the 1 year % change in nominal GDP growth, in USD, around the world, it is apparent how impactful the strong USD has been. Over the last couple quarters, as the USD has surged, global nominal USD-based economic growth has dropped precipitously. Partially explaining the strength of US equities is the relative strength of US nominal GDP growth. Exhibit 42: MSCI Developed World Nominal GDP 1 Year % Change, 20 quarters, in USD (click to enlarge) As of 6/30/2015. A blank space indicates historic data not available. On a quarterly, annualized basis, real GDP growth (in local currency) in the developed world remains subdued, with an average of just 1.63%. Though growth has improved for the most part, it shows no sign of an acceleration. In local terms, the US and UK are the fastest growing economies in the developed world. Compared to Germany or France, Spain’s growth looks much more constructive. Exhibit 43: MSCI Developed World Real GDP 1 Year % Change, in Local Currency (click to enlarge) As of 6/30/2015. A blank space indicates historic data not available. The stronger USD has led to contracting USD-based nominal growth in the emerging markets. Nominal GDP growth in the emerging markets has been contracting for two quarters. China’s nominal growth in USD has slowed from 25+% to under 4%. Brazil has experienced the most pronounced drop in economic growth in USD terms, slowing from a 30+% growth rate as recently as 2011 to now contracting by almost 12.5%. Exhibit 44: MSCI Emerging World GDP Nominal GDP 1 Year % Change, in USD (click to enlarge) As of 6/30/2015. A blank space indicates historic data not available. Average real local currency GDP growth in the emerging markets countries has slowed from an average rate of 4% a year ago to under 3% now. Growth in China and India continues to power ahead at 7%, while Russia and Brazil are showing steady contraction. Broadly, growth trends in manufacturing-centric Asia are far better than trends in resource-centric Latin America. Exhibit 45: MSCI Emerging World GDP Real GDP 1 Year % Change, in Local Currency (click to enlarge) As of 6/30/2015. A blank space indicates historic data not available. Inflation has fallen by over 50% in the last 2 years in the developed world, falling below 1% on average. Inflation remains below the 2% goal of the Federal Reserve and Bank of England. Exhibit 46: MSCI Developed World Consumer Price Index (NYSEARCA: CPI ) 1 Year % Change, Yearly As of 6/30/2015. A blank space indicates historic data not available. Price trends in the Developed World continue to show no indication of rising and are, on a two quarter basis, lower than at any time in the last five years. An average of only 0.21% (one quarter ago) for the 23 countries included is well below the targets of most central banks of around 2%. Due to currency depreciation, inflation is rebounding strongly in Japan. Despite the strongest growth in the developed world, inflation in the US and UK has fallen recently, driven by oil price declines. Exhibit 47: MSCI Developed World CPI 1 Year % Change, Quarterly (click to enlarge) As of 6/30/2015. A blank space indicates historic data not available. Inflation trends are firmer in the emerging markets, with the average CPI just under 4%. Inflation has been particularly low in China, offering hope for stimulus, while in Brazil it has been chronically higher, suggesting less scope for stimulus. Exhibit 48: MSCI Emerging Markets CPI 1 Year % Change, Year End As of 6/30/2015 Emerging markets consumer prices have also trended downward over the last several quarters as well, with a current average of just under 3.5%. Greece has experienced significant deflation while Russia has experienced a surge in consumer prices. Despite sputtering GDP growth, Brazil is seeing inflation increase. Inflation in China is very tame and has moderated some in recent quarters in India. Exhibit 49: MSCI Emerging Markets CPI 1 Year % Change, Quarterly (click to enlarge) As of 6/30/2015. A blank space indicates historic data not available. Higher frequency data has slowed recently in the US, UK and Japan. While still above 50, the manufacturing purchasing managers index (PMI) has slowed steadily for the last three months in the US and UK, not what central bankers were hoping to see as they began raising interest rates. Our diffusion index of countries experiencing monthly increases in the level of PMI has fallen back below 50%. Exhibit 50: Developed World PMI Survey Levels, Monthly (click to enlarge) As of 6/30/2015. A blank space indicates historic data not available. The emerging markets have been stuck in low gear also according to higher frequency data. All the BRICS (Brazil, Russia, India, China and South Africa) have experienced slumping PMI readings in the last few months. Indonesia and South Korea have also been slowing, likely related to the slowdown in China. Mexico has been holding strong, but recently started slipping (similar to Canada) likely due to the slowdown in the US. Exhibit 51: Emerging Markets PMI Survey Levels, Monthly (click to enlarge) As of 6/30/2015 Short-term rates in the developed world countries have declined from recent highs of about 2.5% reached in 2011 to an average of just 0.62% in the most recent quarter. A number of developed economies have negative short-term interest rates, including Belgium, Denmark, France, Germany, Netherlands, and Sweden. Iceland has the highest short-term rates at around 5.5%. Short-term real rates are negative in most countries and below the rate of real GDP growth. Exhibit 52: Developed World Short-term Interest Rates, Quarterly (click to enlarge) As of 6/30/2015 In the emerging markets, short-term rates range from 0.53% in Chile to more than 10% in countries like Russia and Turkey. On average, rates have been fairly steady around 4% for the last five years. China’s short-rates are well below the rate of real GDP growth while they are more appropriately calibrated in India. Rates have spiked in Russia in response to the drop in the Ruble. Exhibit 53: Emerging Markets Short-term Interest Rates (click to enlarge) As of 6/30/2015 Average long-term rates in developed market economies have declined from around 3.5% in 2010 to 1.0-1.5% in the most recent quarters. Switzerland stands out with long-term rates that have fallen to near zero, even entering negative territory recently. Long-term interest rates in the US and UK are well below the rate of real GDP growth, suggesting still very accommodative monetary policy. Long rates in the US are above most other developed countries. Exhibit 54: Developed World Long-term Interest Rates (click to enlarge) As of 6/30/2015. A blank space indicates historic data not available. Long-term rates in the 22 countries included in the emerging markets group have hovered pretty consistently around 5-6% over the last five years. The highest rates are in Greece (recently back above 10%) while the lowest are in the Czech Republic ( Scalper1 News
Scalper1 News