Scalper1 News


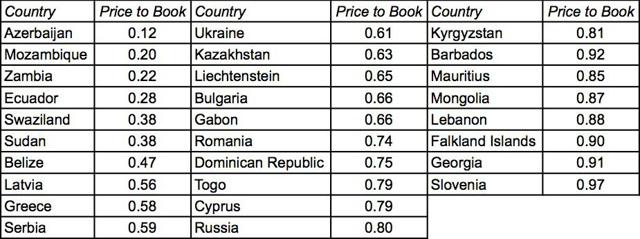 In my last two posts, I looked at country risk, starting with an examination of measures of country risk in this one and how to incorporate that risk into value in the following post . In this post, I want to look at an alternative way of dealing with country risk, especially in investing, which is to let the market price of country risk govern decisions. Pricing Country Risk If you are not a believer in discounted cash flow valuations, I understand, but you still have to consider differences in country risk in your investing strategies. If you use pricing multiples (P/E, Price to Book, EV to EBITDA) to determine how much you will pay for companies, you could assume that the levels of these multiples in a country already incorporate country risk. Thus, you are assuming that the P/E ratios (or any other multiple) will be lower in riskier countries than in safer ones. It is easy to illustrate the impact of risk on any pricing multiple, with a basic discounted cash flow model and simple algebra. To illustrate, note that you can use a stable growth dividend discount model to back into an intrinsic P/E: Dividing both sides of this equation by earnings, we derive an intrinsic P/E ratio: The P/E ratio that you should expect to observe in a country will be a function of the efficiency with which firms generate earnings (measured by the payout ratio), the expected growth in these earnings (g) and the risk in these earnings (captured by the cost of equity). Holding the growth and earnings efficiency constant, then, you should expect to see lower P/E ratios in countries with higher risk and higher P/E ratios in safer countries. You can use the same process to extract the determinants of price to book ratios or enterprise value multiples and you will arrive at the same conclusion. Equity Multiples To see how well this pricing paradigm works, I started by looking at P/E ratios by country in July 2015. To estimate the P/E ratio for a country, I tried three variants. In the first, I compute the P/E ratio for each company in the country (where it was computable) and then average across these P/E ratios. To the extent that there are small companies with outlandish P/E ratios in the sample (and there are many), these ratios will be skewed upwards. In the second, I compute a weighted average P/E ratio across companies, with the weights based upon net income. This ratio is less affected by outliers, but it excludes money-losing firms (since the P/E ratio is not meaningful for these companies). In the third, I add up the market values of equity across all companies in the market and divide by aggregated net income for all companies, including money-losing companies, i.e., an aggregated P/E ratio. This ratio has the advantage of including all listed firms in a market but big money-losing firms will push this measure up. The picture below summarizes differences in P/E ratios across the world, with the weighted average P/E ratio as the primary measure, but with all three reported for each country. Source: chartsbin.com As you can see, P/E ratios are noisy, with some very risky countries (like Venezuela) trading at high P/E ratios and safe countries at lower values, not surprising given how much earnings can shift from year to year. For the most part, the riskiest countries are the ones where stocks trade at the lowest multiple of earnings. To get a more stable measure of pricing, I computed price to book values by country, again using the simple and weighted averages across companies and aggregated values and report the weighted average Price to Book in the picture below: Source: chartsbin.com As with P/E ratios, there are outliers and Venezuela still stands out with an absurdly high price to book ratio, incongruous given the risk in that country. For the most part, though, the PBV ratio is correlated with country risk, as you can see in this list of the 28 countries that have price to book ratios that are less than one in July 2015: Weighted average PBV ratio in July 2015 Enterprise Value Multiples Both P/E and PBV ratios are equity multiples and may reflect not just country risk but also variations in financial leverage across countries. To remedy this problem, I look at EV to EBITDA multiples across countries: Source: chartsbin.com Looking at this map, it is quite clear that there is much less correlation between EV/EBITDA multiples and country risk than there is with the equity multiples. While it is true that the lowest EV/EBITDA multiples are found in the riskiest parts of the world (Russia & Eastern Europe, parts of Latin America and Africa), the highest EV/EBITDA multiples are in India and China. There are two ways of looking at these results. The optimistic take is that if you have to pick a multiple to use to compare companies that are listed in different markets, you should use an enterprise value multiple, since it is less affected by country risk. The pessimistic take is that you are likely to overvalue emerging market companies, if you use EV/EBITDA multiples, since they are less likely to incorporate country risk. Using these multiples The standard approach to pricing a company is to choose a multiple and compare how stocks that you deem “comparable” are being priced based on that multiple. This approach can be extended to deal with country risk, albeit with some limitations, in one of four ways: Compare how stocks listed in a country are priced to find “bargains”: You could compare P/E ratios across Brazilian companies on the assumption that Brazilian country risk is already incorporated in the pricing and buy (sell) the lowest (highest) P/E stocks. The danger with this approach is that you are assuming that all Brazilian companies are equally exposed to Brazilian country risk. Compare how stocks within a sector in a country are priced: Rather than compare across all stocks in a market, you could compare stocks within a sector in that market, on the assumption that both country and sector risk are already in the prices. Thus, you could compare the EV/Sales ratios of Brazilian retailers and argue that the retailers that trade at the lowest multiples of revenues are cheapest. The downside is that you may not find enough companies in a country, especially in a smaller market. Compare how stocks within a sector are priced globally: A logical outgrowth of globalization is to compare companies within a sector, even if they are listed in different countries. Thus, you could compare Vale (NYSE: VALE ) to other mining companies listed globally and Coca-Cola (NYSE: KO ) to beverage companies across countries. The benefit is that you have more comparable firms but the danger is that you are ignoring country risk. Compare stocks within a sector that are priced globally, but control for country risk: In this last approach, you look at the pricing of companies across a sector but try to control for country risk by looking at differences between how the market is pricing companies in developed markets and emerging markets. No matter which approach you use, you have the pluses and minuses of pricing. The plus is that you will always be able to find “cheap” stocks, because you are making relative judgments and it is simple to get the data. The minus is that if stocks are collectively overpriced, either at a country or sector level, a pricing comparison will just yield the least overpriced stock in the country or sector. Valuing and Pricing: Final Thoughts In my last post , I looked at ways in which you can try to incorporate country risk into the values of companies. In this one, I looked at how to price these companies, based upon how the market is pricing other companies in risky countries. As I have argued in my posts on price versus value, the two approaches can yield divergent numbers and conclusions. Thus, you could value a company with all its operations in China, using an appropriate equity risk premium for China, and conclude that the stock is overvalued. You could then compare the P/E ratio for the same company to the P/E ratio for the Chinese market and decide that it is cheap, because it trades at a lower multiple of earnings than a typical Chinese company. I tend to go with the first approach, since I have more faith in my valuation abilities than in my pricing abilities, i.e., I am more an investor than a trader. However, I am not quick to dismiss those who use pricing metrics to pick investments, since a nimble trader can play the pricing game very profitably. If you are unsure about where you fall in this process, I would suggest that you both value and price companies and buy only when both signal that the stock is a bargain. Papers to read Data attachments Scalper1 News
Scalper1 News