Scalper1 News
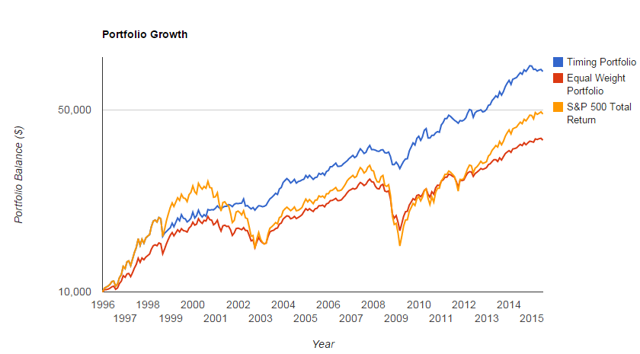
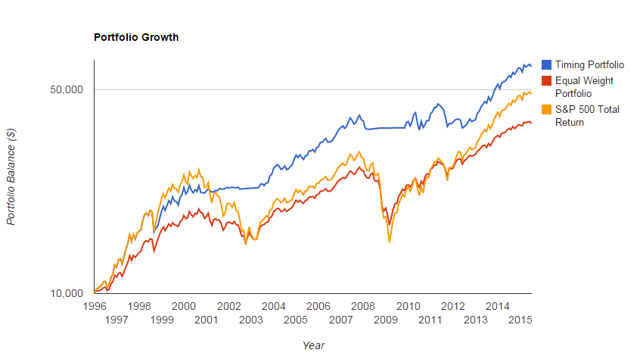
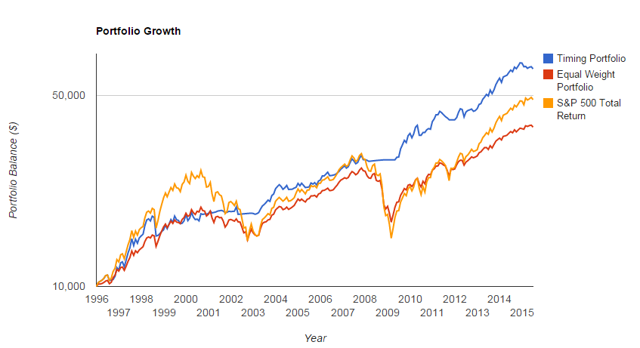 One of the criticisms of momentum systems is they are prone to crashes when momentum reverts. The system highlighted in this article can be implemented using any number of “life style” or target-risk funds or ETFs. The system chooses from a small number of funds that reflect a range of asset allocation models. The purpose is to employ a diverse, momentum-based asset allocation system. Rather than allocate based on momentum to singular asset classes which increases the potential for momentum crashes, we allocate to asset allocation models themselves. The tests were conducted using Portfolio Visualizer . If you have not checked out their site I highly recommend this free tool. Also, for additional research on this topic please see this award-winning paper by Corey Hoffstein of Newfound Research which served as the original inspiration for these tests. I ran 5 tests using Vanguard Target-risk funds and the Vanguard Five Hundred Index Fund (MUTF: VFINX ) . The Target-risk funds used were the Vanguard LifeStrategy Conservative Growth Fund (MUTF: VSCGX ) , the Vanguard LifeStrategy Growth Fund (MUTF: VASGX ) , the Vanguard LifeStrategy Income Fund (MUTF: VASIX ) and the Vanguard LifeStrategy Moderate Growth Fund (MUTF: VSMGX ) . According to Vanguard these funds are “a series of broadly diversified, low-cost funds with an all-index, fixed allocation approach that may provide a complete portfolio in a single fund. The four funds, each with a different allocation, target various risk-based objectives.” The funds allocate different percentages to bonds (international and domestic) and stocks (international and domestic). The tests consisted of two simple momentum systems I frequently use on Scotts Investments . The first is a simple relative strength system where the best performing asset based on trailing returns is purchased. The seconds is a “dual momentum” system that holds the best performing fund based on trailing returns. A second filter is used, absolute momentum, to switch the best performing asset to cash if its total returns were below the risk-free rate of cash over the lookback period. This is similar to my Dual Momentum Portfolio , which is inspired by a paper written by Gary Antonacci and available on Optimal Momentum . Antonacci’s book, Dual Momentum Investing: An Innovative Strategy for Higher Returns with Lower Risk , also highlights his specific system in greater detail. The test results for the relative momentum system is below. All tests were from 1996 – present. The first model used a single performance window of 5 months. The best performing fund was held, and trades were performed at the start of each month. For comparison purposes an “equal-weight” version each portfolio is also provided but since these are asset allocation funds the comparison is a bit redundant (equal weight is essentially a balanced fund itself): Timing Model Assets Ticker Name VSMGX Vanguard LifeStrategy Moderate Growth Fund VASIX Vanguard LifeStrategy Income Fund VSCGX Vanguard LifeStrategy Conservative Growth Fund VASGX Vanguard LifeStrategy Growth Fund Portfolio Initial Balance Final Balance CAGR Std.Dev. Best Year Worst Year Max. Drawdown Sharpe Ratio Sortino Ratio Stock Market Correlation Timing Portfolio $10,000 $51,597 8.78% 8.53% 24.22% -10.53% -18.49% 0.75 1.14 0.84 Equal Weight Portfolio $10,000 $35,621 6.73% 8.56% 19.57% -22.73% -32.75% 0.53 0.75 0.96 S&P 500 Total Return $10,000 $48,177 8.40% 15.47% 33.36% -37.00% -50.95% 0.45 0.64 0.99 What if we add VFINX to the pool of potential assets? We would expect higher volatility with potentially higher returns since a 100% stock allocation is held at various times ( you will also see the equal weight portfolio has slightly higher returns/volatility because it is tilted towards stocks with its allocation to VFINX): Portfolio Initial Balance Final Balance CAGR Std.Dev. Best Year Worst Year Max. Drawdown Sharpe Ratio Sortino Ratio Stock Market Correlation Timing Portfolio $10,000 $70,161 10.51% 10.21% 33.21% -10.53% -18.49% 0.8 1.24 0.82 Equal Weight Portfolio $10,000 $38,242 7.12% 9.85% 21.35% -25.59% -36.63% 0.51 0.73 0.98 S&P 500 Total Return $10,000 $48,177 8.40% 15.47% 33.36% -37.00% -50.95% 0.45 0.64 0.99 (click to enlarge) Returns and standard deviation increase, which may have been expected. However, max drawdown and the worst year remained the same, so adding a 100% stock allocation did not impact our biggest loss. Next, we test a dual momentum approach with a 12-month look back period. The top 1 fund is purchased based on 12-month returns, but only if the returns are also greater than the return on the risk free rate of cash. Testing the 4 life style funds (excluding VFINX) yielded the following results: Portfolio Initial Balance Final Balance CAGR Std.Dev. Best Year Worst Year Max. Drawdown Sharpe Ratio Sortino Ratio Stock Market Correlation Timing Portfolio $10,000 $49,142 8.51% 8.78% 22.26% -7.61% -16.17% 0.71 1.08 0.73 Equal Weight Portfolio $10,000 $35,621 6.73% 8.56% 19.57% -22.73% -32.75% 0.53 0.75 0.96 S&P 500 Total Return $10,000 $48,177 8.40% 15.47% 33.36% -37.00% -50.95% 0.45 0.64 0.99 What if we include VFINX? Portfolio Initial Balance Final Balance CAGR Std.Dev. Best Year Worst Year Max. Drawdown Sharpe Ratio Sortino Ratio Stock Market Correlation Timing Portfolio $10,000 $59,952 9.62% 10.45% 33.21% -6.73% -17.29% 0.71 1.09 0.73 Equal Weight Portfolio $10,000 $38,242 7.12% 9.85% 21.35% -25.59% -36.63% 0.51 0.73 0.98 S&P 500 Total Return $10,000 $48,177 8.40% 15.47% 33.36% -37.00% -50.95% 0.45 0.64 0.99 (click to enlarge) Finally, what is we use a 5-month look back period, like the relative strength tests, instead of 12 months? Portfolio Initial Balance Final Balance CAGR Std.Dev. Best Year Worst Year Max. Drawdown Sharpe Ratio Sortino Ratio Stock Market Correlation Timing Portfolio $10,000 $62,456 9.85% 9.72% 33.21% -4.74% -15.38% 0.77 1.22 0.7 Equal Weight Portfolio $10,000 $38,242 7.12% 9.85% 21.35% -25.59% -36.63% 0.51 0.73 0.98 S&P 500 Total Return $10,000 $48,177 8.40% 15.47% 33.36% -37.00% -50.95% 0.45 0.64 0.99 (click to enlarge) The sharpe ratio in all 5 tests ranged from .71 – .80 and in each instance outperformed an equal weight portfolio and the S&P 500. Investors looking for a simple, momentum based system that avoids “all-in” investments in single asset classes should consider a system using asset allocation funds. Disclosures: None Scalper1 News
Scalper1 News