Scalper1 News
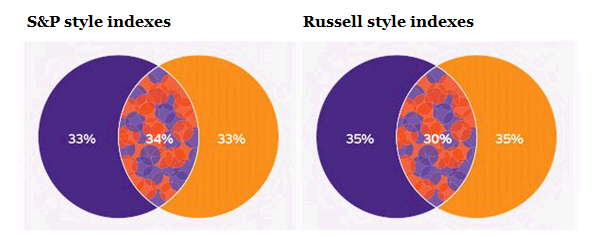
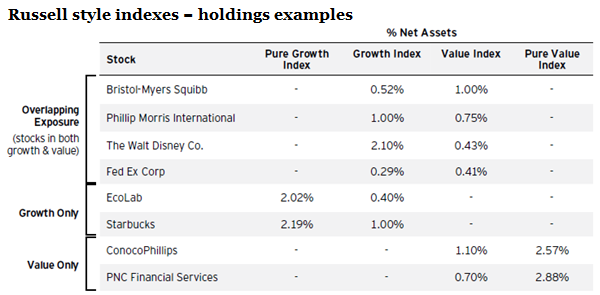
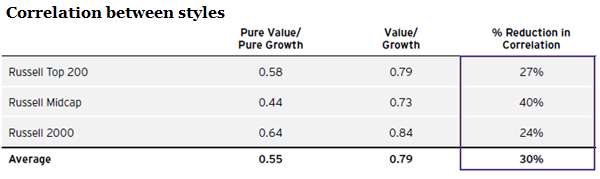 Summary In order to benefit from diversification within an investment portfolio, we believe investors need to combine assets that are less-than-perfectly correlated. Indexes representing growth and value investment styles often have the same holdings, which diminishes the potential diversification and risk reduction benefit within a portfolio. Investors can realize increased diversification benefits through exposure to pure style-based indexes that have no constituent overlap and weight constituents by style strength instead of market capitalization. To ensure proper style diversification, it’s critical to check your correlations By John G. Feyerer, Vice President, Director of Equity ETF Product Strategy, Invesco PowerShares Capital Management LLC Diversification. As the old saying goes, it’s the only free lunch in finance. Construction of investment portfolios involves mixing low or uncorrelated asset classes with varying risk/return profiles in order to attain the desired balance of risk and return potential. Correlation is a statistical measure of how securities move in relation to each other. For investors to benefit from diversification, they must combine assets that are less than perfectly correlated. The lower the correlation, the greater the diversification benefit. (While low correlations are good, negative correlations are even better.) Of course, diversification does not guarantee a profit or eliminate the risk of loss. Style investing as a means of diversification Traditional style investing, commonly used in the asset allocation process, is one means of diversifying a portfolio. A simple example of traditional style investing involves employing both growth and value investment styles across a full spectrum of company sizes – large-, mid- and small-cap. This approach is designed to improve performance, while reducing portfolio risk. Style allocations can also be used to tilt an investment portfolio based on an investor’s market outlook. Historically, investor implementation strategies have focused on finding active managers who could deliver “alpha,” or risk-adjusted performance, to fill each style box allocation. In recent years, passive strategies have also been widely adopted, as evidenced by $160 billion in net flows into style-based index mutual funds and $54 billion in net flows into style-based index exchange-traded funds (ETFs) over the past three years. During this time, style-based ETFs have grown to represent approximately 10% of the $2 trillion in U.S. ETF assets under management. 1 Constituent overlap can increase portfolio risk Given the desired outcome of improving performance while reducing portfolio risk, we believe it is important for ETF investors to “look under the hood” of the more popular style indices to understand the index construction methodology. Russell and Standard & Poor’s (S&P) provide some of the most widely used style indices, and both have at least 30% constituent overlap between growth and value allocations, as shown in the graphic below. Source: Bloomberg, L.P., May 31, 2015 What do we mean by this? An examination of index holdings illustrates that a number of companies have their weight apportioned between both the growth and value indexes based upon their strength of style. Index providers typically structure their style indexes in this way to provide exhaustive coverage (so that all parent index stocks are included in these benchmark indexes) and cost-efficient* exposure to the broad style market. But the overlap of constituent companies within these indexes typically results in higher correlations, which can help reduce diversification and increase portfolio risk. Given that nearly one-third of both the S&P and Russell style indexes contain the same stocks, investors should evaluate the degree to which they can benefit from diversification through a reduction in correlation. Pure style investing eliminates the issue of constituent overlap Recently, Russell introduced a suite of pure style indexes designed to include only stocks with pure growth and pure value characteristics. Unlike traditional style indexes, the Russell pure style methodology eliminates overlap and weights constituents based upon relative style attractiveness. This approach not only eliminates the issue of constituent overlap, but also focuses the exposure on companies that exhibit the greatest style strength. The table below illustrates these differences. Notice that the Russell growth style and the Russell value style both include four of the same large companies, while the Russell pure growth style and the Russell pure value style have no constituent overlap. Source: Bloomberg L.P., as of May 27, 2015 Now let’s consider the impact on correlations. In the table below, note how highly correlated Russell’s traditional value and growth style indexes are across the various indices: 0.79, 0.73 and 0.84 (a level of 1.00 reflects perfect correlation). This isn’t entirely surprising when you consider that a portion of each index consists of the exact same companies. Now observe the lower correlations between the various Russell pure value indexes: 0.58, 0.44 and 0.64. Russell’s pure style indexes show an average reduction in correlation of 30% when compared to Russell’s traditional value and growth indexes – driven by the fact that there isn’t any constituent overlap between the pure style indexes, as well as the fact that constituents are weighted based on style strength, rather than on market capitalization. Source: Russell Investments, as of July 1998-March 2015 In order to benefit from the “free lunch” that is afforded by diversification, we believe investors need to pay close attention to the correlations between the allocations within their portfolio. Some of the most commonly used style indices have significant constituent overlap – resulting in higher correlations, and thus hampering the ability of investors to reduce portfolio risk. By employing a strict construction discipline, Russell pure style indexes isolate companies that exhibit stronger style characteristics – resulting in a sharper, more focused and stylistically pure index. Learn more about Invesco PowerShares’ suite of ETFs based upon Russell’s pure style methodology. Source Morningstar, March 31, 2015 * Since ordinary brokerage commissions apply for each buy and sell transaction, frequent trading activity may increase the cost of ETFs. Important information The Russell Top 200 Pure Growth Portfolio holds a 0.2% position in Bristol-Myers Squibb (NYSE: BMY ), a 0.76% position in The Walt Disney Co. (NYSE: DIS ), a 2.18% position in Ecolab (NYSE: ECL ) and a 2.01% position in Starbucks (NASDAQ: SBUX ) as of July 8, 2015. The Russell Top 200 Pure Value Portfolio holds a 2.81% position in ConocoPhillips (NYSE: COP ) and a 2.97% position in PNC Financial Services (NYSE: PNC ) as of July 8, 2015. The Russell Top 200® Index , a trademark/service mark of the Frank Russell® Co., is an unmanaged index comprising the largest 200 securities by U.S. market cap. The Russell Midcap® Index , a trademark/service mark of the Frank Russell Co., is an unmanaged index considered representative of mid-cap stocks. The Russell 2000® Index , a trademark/service mark of the Frank Russell Co., is an unmanaged index considered representative of small-cap stocks. Russell is a trademark of the Frank Russell Co. There are risks involved with investing in ETFs, including possible loss of money. Index-based ETFs are not actively managed. Actively managed ETFs do not necessarily seek to replicate the performance of a specified index. Both index-based and actively managed ETFs are subject to risks similar to stocks, including those related to short selling and margin maintenance. Ordinary brokerage commissions apply. The Fund’s return may not match the return of the Index. The Funds are subject to certain other risks. Please see the current prospectus for more information regarding the risk associated with an investment in the Funds. Growth stocks tend to be more sensitive to changes in their earnings and can be more volatile. A value style of investing is subject to the risk that the valuations never improve or that the returns will trail other styles of investing or the overall stock markets. Stocks of small and mid-sized companies tend to be more vulnerable to adverse developments, may be more volatile, and may be illiquid or restricted as to resale. Investing in securities of large-cap companies may involve less risk than is customarily associated with investing in stocks of smaller companies. Investments focused in a particular industry or sector are subject to greater risk, and are more greatly impacted by market volatility, than more diversified investments. The information provided is for educational purposes only and does not constitute a recommendation of the suitability of any investment strategy for a particular investor. Invesco does not provide tax advice. The tax information contained herein is general and is not exhaustive by nature. Federal and state tax laws are complex and constantly changing. Investors should always consult their own legal or tax professional for information concerning their individual situation. The opinions expressed are those of the authors, are based on current market conditions and are subject to change without notice. These opinions may differ from those of other Invesco investment professionals. NOT FDIC INSURED MAY LOSE VALUE NO BANK GUARANTEE All data provided by Invesco unless otherwise noted. Invesco Distributors, Inc. is the U.S. distributor for Invesco Ltd.’s retail products and collective trust funds. Invesco Advisers, Inc. and other affiliated investment advisers mentioned provide investment advisory services and do not sell securities. Invesco Unit Investment Trusts are distributed by the sponsor, Invesco Capital Markets, Inc., and broker-dealers including Invesco Distributors, Inc. PowerShares® is a registered trademark of Invesco PowerShares Capital Management LLC (Invesco PowerShares). Each entity is an indirect, wholly owned subsidiary of Invesco Ltd. ©2015 Invesco Ltd. All rights reserved. How much growth exposure is in your value index? Perhaps more than you think by Invesco Blog Scalper1 News
Scalper1 News