Scalper1 News
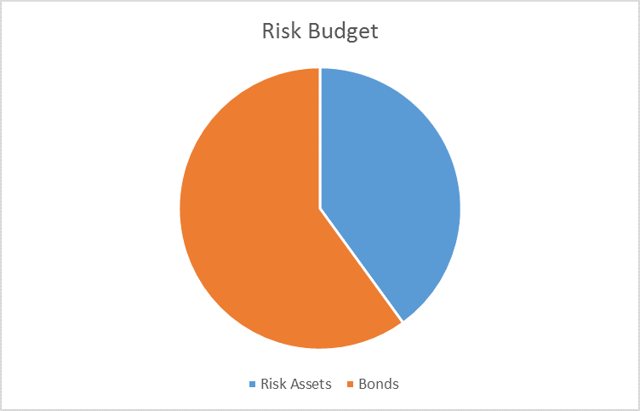
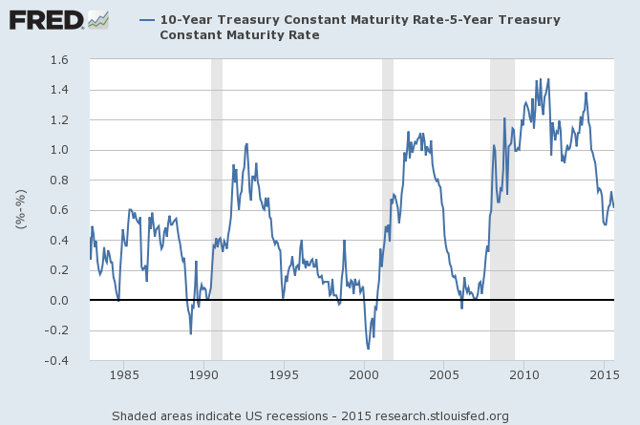
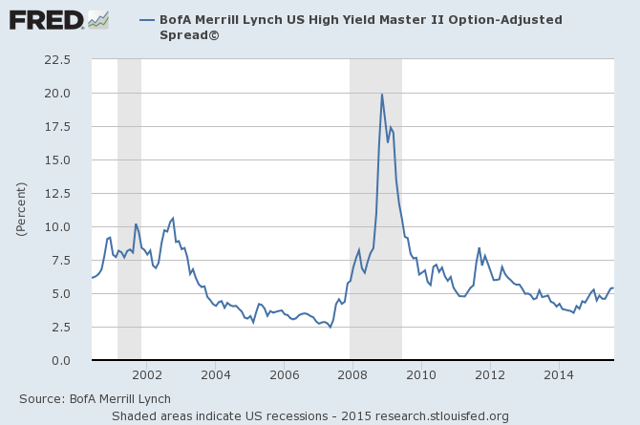
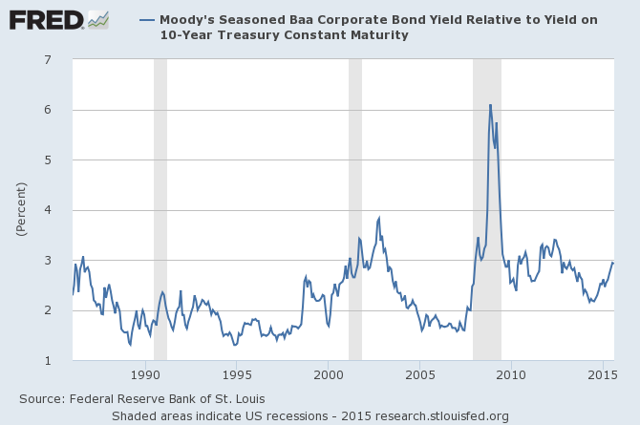
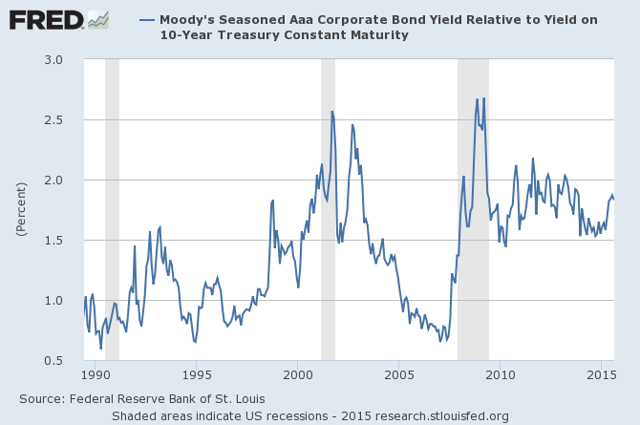
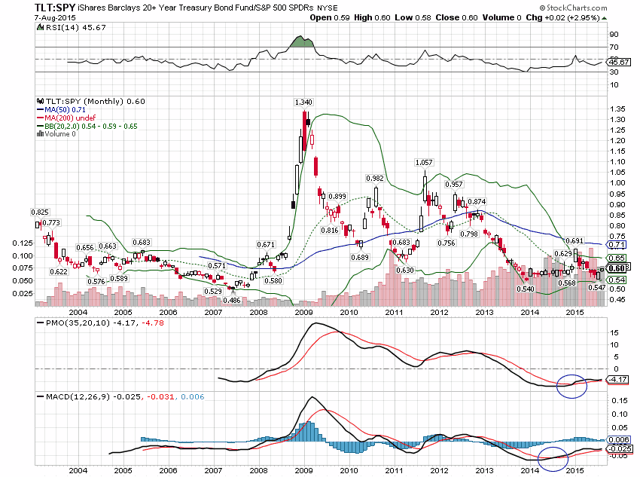
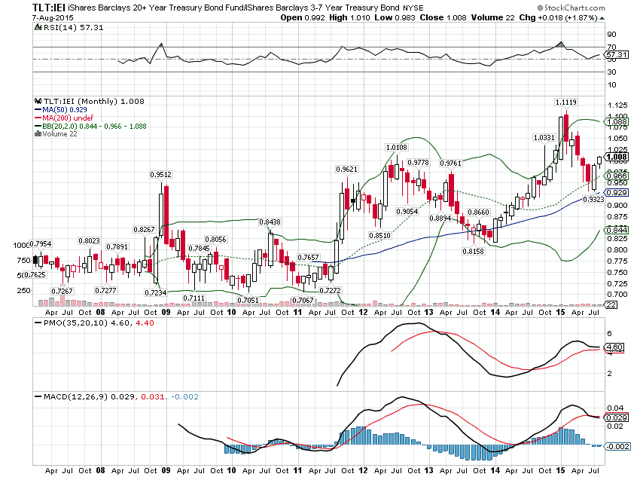
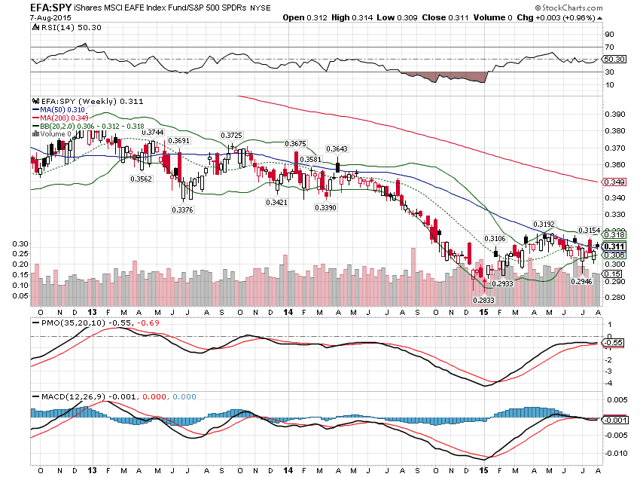
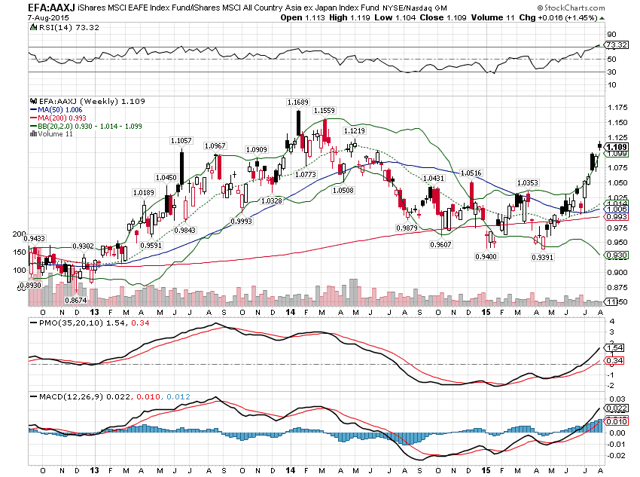
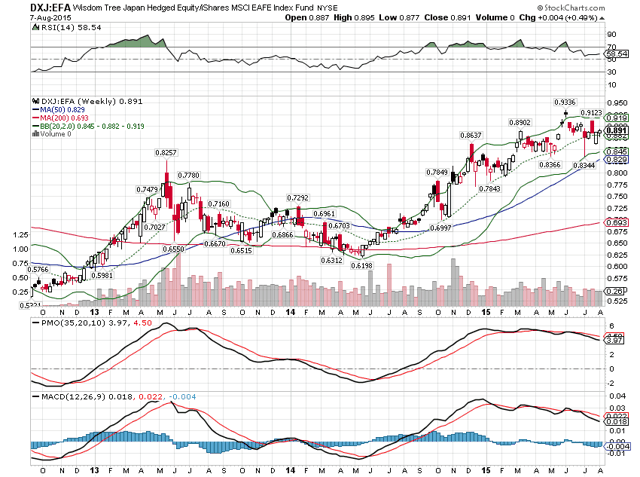
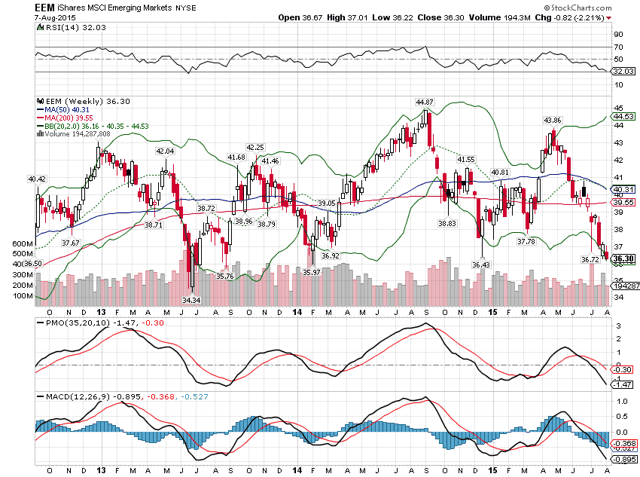
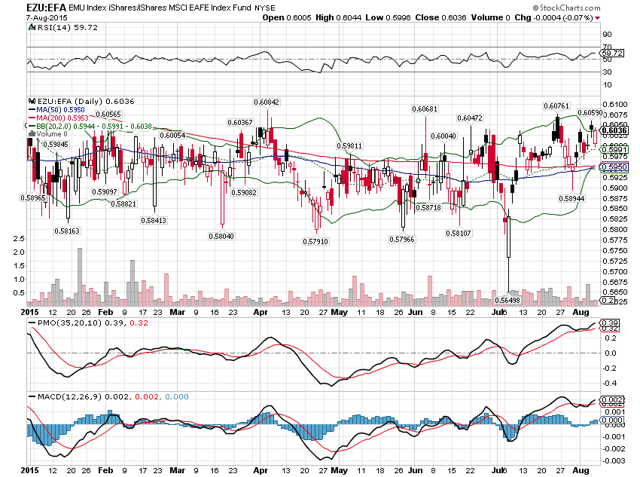
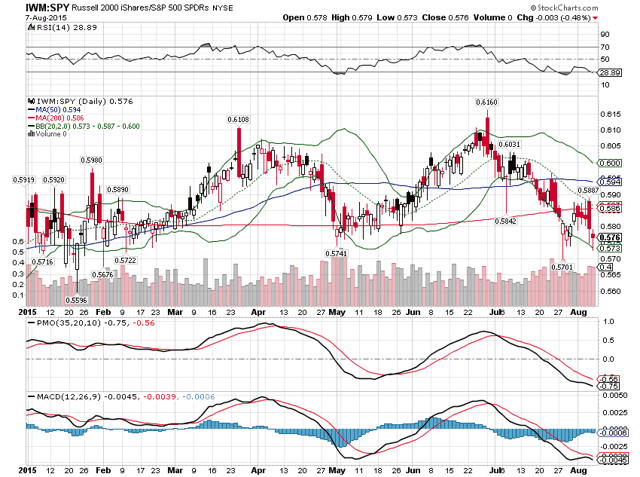
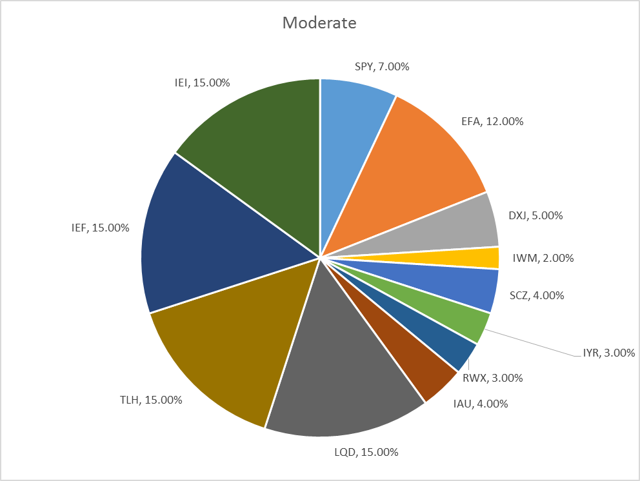 By Joseph Y. Calhoun I am lowering our risk budget this month, based on several factors. For the moderate risk investor, the allocation between risk assets and bonds moves to a defensive 40/60 versus the benchmark of 60/40 and last month’s 50/50. Credit spreads have resumed widening, as crude oil prices have resumed their downtrend. The downtrend in high-yield credit prices may be concentrated in energy issues, but it isn’t confined to that sector. Momentum has shifted notably over the last month to long-term bonds, as inflation expectations have fallen considerably. The yield curve flattened during the month. Although the curve has not fully flattened yet – indeed, it sits in the middle of its historical range – I am still uncertain as to the degree of flattening we’ll see before the next recession. I am choosing to be conservative in my approach to asset allocation. Valuations are still high by historical standards, and revenue and earnings growth is very weak. (click to enlarge) Of the four items we monitor for asset allocation, three are flashing warnings. The change in credit spreads last month approached 10%, well above the 7.5% level we use as a warning sign. Momentum, as I’ve noted numerous times the last few months, has rolled over for the S&P 500, and now, upward momentum can be observed in long-term bonds. It is not as concerning as it might be, though, since the rally in the long end has also included high-grade corporates. Lastly, reliable valuation methods continue to show a stock market near all-time high valuation levels. The only indicator not flashing a warning is the yield curve, which is still far from flat – the condition most commonly associated with pre-recession. (click to enlarge) With rates so low, though, an outright inversion seems highly unlikely, and even getting to flat would seem a heroic feat. If that happens, I cannot imagine that stocks will not have already succumbed to altitude sickness. Credit spreads moved wider on the month, enough to trigger a Sell signal for the stocks. High yield spreads are not yet at levels associated with past recessions, but the rate of change is concerning. Historically, rapidly widening spreads are a sign of stress, and are associated with stock market corrections. Furthermore, Baa spreads are already at recession-associated levels, and investment-grade spreads remain elevated across the credit spectrum. (click to enlarge) (click to enlarge) (click to enlarge) Momentum shifted during the month to bonds, a trend that is actually pretty well established, although it stumbled a bit earlier this year: (click to enlarge) Longer-term bonds continue to outperform shorter maturities, exactly what we would expect with inflation and nominal growth expectations falling: (click to enlarge) On the equity side, EAFE continues to outperform the US market this year, although not by a lot: (click to enlarge) Asia, which outperformed last year and into this one, has flagged badly recently, and I am closing out that position: (click to enlarge) Japan, however, continues to outperform. As I’ve stated numerous times, I think the country has entered a secular bull market: (click to enlarge) Emerging markets have not recovered, and now sit at the bottom of their several years-old range. As I’m moving to a more defensive posture, it does not make sense to maintain exposure to these markets. If the dollar starts to fall, I will reconsider the position: (click to enlarge) Europe outperformed on the month, and I would maintain that exposure: (click to enlarge) Small cap stocks underperformed badly versus large caps in July. In a defensive mode, small cap allocations should be minimized. (click to enlarge) Lastly, I am maintaining a small position in gold, as I believe the US dollar is peaking. The sentiment toward gold is extremely bearish right now, so a small position makes sense from a contrarian perspective. Moderate risk allocation : (click to enlarge) I also run two asset allocation models (one aggressive, one more moderate) based on momentum. These models ignore all fundamental and economic information in favor of just allocating to asset classes that are exhibiting momentum. Here’s where those models stand at the end of the week (rebalancing is monthly): Aggressive Version : 50% TLT 50% EWJ Moderate Version : 25% TLT 25% TLH 25% SCZ 25% IEF As you can see, both of these models are overweight bonds, especially of the long-term variety. More information on these momentum models can be found here . Scalper1 News
Scalper1 News