Scalper1 News
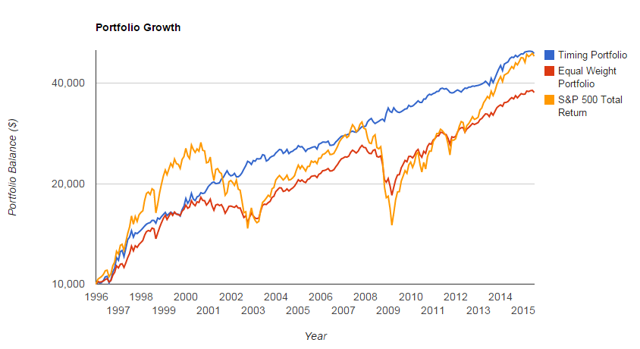
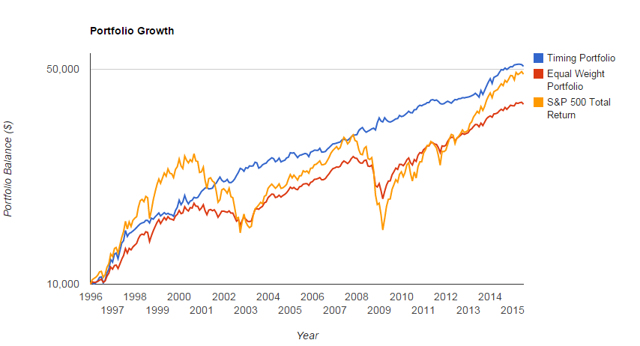 A Diverse Momentum System Using Vanguard Allocation Funds generated a plethora of feedback. Can we improve or simplify the system? And does it hold up well if variables are changed? The systems tested in the original article rarely held the Moderate Growth (MUTF: VSMGX ), which allocate 60% stocks/40% bonds, or Conservative Growth (MUTF: VSCGX ), with a 60% bonds/40% stock allocation. The majority of returns were generated by the Growth (MUTF: VASGX ), Income (MUTF: VASIX ), and the S&P 500 Fund (MUTF: VFINX ). VASGX’s objective is to hold 80% equities and 20% bonds and VASIX’s objective is to hold 80% bonds and 20% equities. For example, you can see below the returns of the dual momentum 12-month system without VSCGX or VSMGX. The system rotated between VFINX, VASIX, VASGX, and cash: Portfolio Initial Balance Final Balance CAGR Std.Dev. Best Year Worst Year Max. Drawdown Sharpe Ratio Sortino Ratio Timing Portfolio $10,000 $60,384 9.66% 10.46% 33.21% -6.73% -17.29% 0.71 1.09 Equal Weight Portfolio $10,000 $40,025 7.37% 10.71% 23.23% -27.31% -38.97% 0.5 0.71 S&P 500 Total Return $10,000 $48,177 8.40% 15.47% 33.36% -37.00% -50.95% 0.45 0.64 These returns are largely in line with the original test, which included all 5 funds and cash: Portfolio Initial Balance Final Balance CAGR Std.Dev. Best Year Worst Year Max. Drawdown Sharpe Ratio Sortino Ratio Timing Portfolio $10,000 $59,952 9.62% 10.45% 33.21% -6.73% -17.29% 0.71 1.09 Equal Weight Portfolio $10,000 $38,242 7.12% 9.85% 21.35% -25.59% -36.63% 0.51 0.73 S&P 500 Total Return $10,000 $48,177 8.40% 15.47% 33.36% -37.00% -50.95% 0.45 0.64 Thus, we are left with a system which largely generated returns based on an 80/20, 20/80, 100% equity, or, with the dual momentum systems, cash (which does not generate a return, but improved risk-adjusted performance by avoiding crashes). I found similar results with the 5-month relative strength and dual momentum systems – dropping the 2 moderate funds had minimal impact on results. However, another option is to employ a volatility adjusted momentum system to the strategy. This gets us closer to the Hoffstein paper referenced in the first article , which compares on a monthly basis, the Sharpe Ratio over a look-back period and invested in the option with the greatest risk-adjusted return. Portfolio Visualizer allows users to make a “volatility adjustment” to momentum tests, whereby the “performance number can be volatility adjusted, in which case the model adjusts the asset return performance by calculating the average daily return over the timing period divided by the standard deviation of daily total returns over the volatility window period.” When adding a volatility adjustment to our momentum strategy, we would expect a more diverse source of returns in our 5-fund model. Since we are no longer ranking the funds based purely on momentum and instead on their risk-adjusted returns, the moderate funds should have a greater representation in our back tests. Moderate funds will tend to generate lower pure momentum because they are less concentrated in either stocks or bonds, but their risk-adjusted returns may score higher at times because they have greater balance and potentially lower volatility than the funds more concentrated in stocks or bonds. In addition to adjusting for volatility, we can also add a 100% bond fund, the Vanguard Intermediate-Term Treasury Fund (MUTF: VFITX ) to our tests, to offset our ( potential ) exposure to 100% stocks via VFINX. In addition, this gives us the full spectrum of stock/bond allocation, from 0-100%. A relative momentum system with a 5-month look-back period for returns and volatility adjustment (essentially a Sharpe ratio calculation, excluding the risk-free rate, which is a mute point since we are ranking funds relative to each other) in our 6 fund portfolio of VFINX, VASIX, VASGX, VSMGX, VSCGX and VFITX generates the following: Portfolio Initial Balance Final Balance CAGR Std.Dev. Best Year Worst Year Max. Drawdown Sharpe Ratio Sortino Ratio Timing Portfolio $10,000 $49,837 8.59% 6.82% 24.77% -1.70% -11.01% 0.89 1.49 Equal Weight Portfolio $10,000 $37,503 7.01% 8.08% 19.13% -19.10% -29.10% 0.59 0.86 S&P 500 Total Return $10,000 $48,177 8.40% 15.47% 33.36% -37.00% -50.95% 0.45 0.64 A 12 volatility adjusted momentum system on the same portfolio generates the lowest standard deviation and drawdown of any system tested yet: Portfolio Initial Balance Final Balance CAGR Std.Dev. Best Year Worst Year Max. Drawdown Sharpe Ratio Sortino Ratio Timing Portfolio $10,000 $49,085 8.50% 6.48% 23.09% 0.36% -4.88% 0.92 1.64 Equal Weight Portfolio $10,000 $37,503 7.01% 8.08% 19.13% -19.10% -29.10% 0.59 0.86 S&P 500 Total Return $10,000 $48,177 8.40% 15.47% 33.36% -37.00% -50.95% 0.45 0.64 (click to enlarge) In both the 5 and 12-month volatility adjusted system, we also see much greater representation of all funds, unlike the momentum-only system. We could test variations of this strategy almost indefinitely. However, two final tests are relevant for today’s article. What if we exclude the conservative growth and moderate growth funds in our volatility-adjusted system? Can we simplify things without impacting results? A 5-month volatility adjusted system and a portfolio of VFINX, VFITX, VASIX, and VASGX generates comparable returns to the 6 fund portfolio: Portfolio Initial Balance Final Balance CAGR Std.Dev. Best Year Worst Year Max. Drawdown Sharpe Ratio Sortino Ratio Timing Portfolio $10,000 $50,103 8.62% 7.00% 22.79% -1.49% -11.01% 0.87 1.46 Equal Weight Portfolio $10,000 $38,487 7.16% 7.86% 19.66% -17.15% -27.12% 0.62 0.91 S&P 500 Total Return $10,000 $48,177 8.40% 15.47% 33.36% -37.00% -50.95% 0.45 0.64 And the 12 month system and 4 fund portfolio also generates comparable returns to the 6 fund portfolio: Portfolio Initial Balance Final Balance CAGR Std.Dev. Best Year Worst Year Max. Drawdown Sharpe Ratio Sortino Ratio Timing Portfolio $10,000 $51,111 8.73% 6.67% 27.77% 0.36% -6.12% 0.93 1.67 Equal Weight Portfolio $10,000 $38,487 7.16% 7.86% 19.66% -17.15% -27.12% 0.62 0.91 S&P 500 Total Return $10,000 $48,177 8.40% 15.47% 33.36% -37.00% -50.95% 0.45 0.64 (click to enlarge) In both cases, the 4 fund system had only slightly higher volatility but comparable risk-adjusted returns. Hopefully, these tests, while not intended to be exhaustive, provide some insight into the potential for a Diverse Momentum strategy. My initial thoughts are that a momentum system of asset allocation funds has merit. Diversification within the assets themselves appears to improve risk-adjusted returns, but the bulk of the returns is in the extremes and not in the moderate allocation funds. In addition, using risk-adjusted returns to select assets generates superior returns compared to purely momentum systems like the ones in our first article. Areas of further exploration could include additional asset allocation funds, such as The Permanent Portfolio (MUTF: PRPFX ), or other alternative allocation models, changes to the look-back period, modifications to the 100% stock and bond funds, and/or additional trend filters. Disclosures: None Scalper1 News
Scalper1 News