Scalper1 News
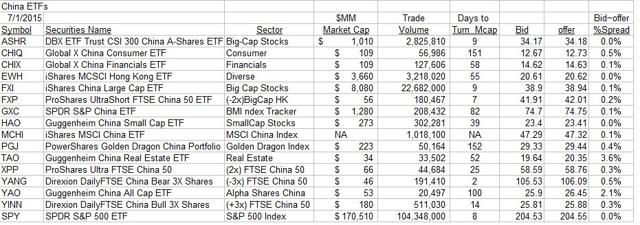
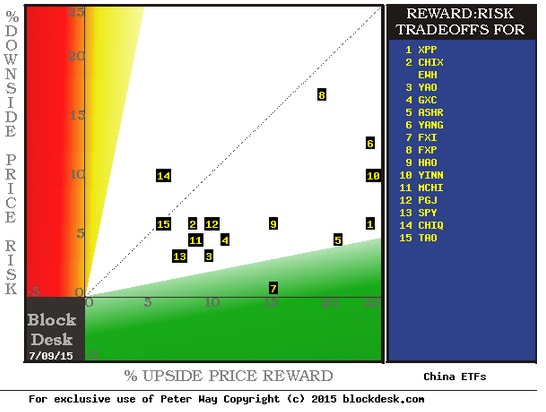
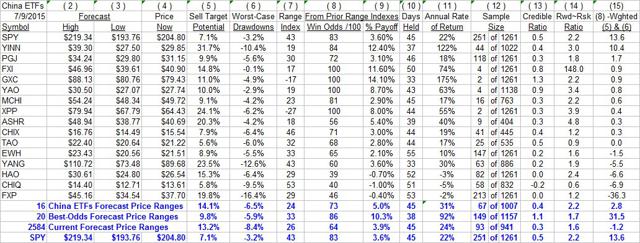 Summary What do we know about China and its securities? Only that in the past weeks those have given up in price virtually all they achieved in the 2015 second quarter. So we’re back to where major Chinese stock indexes were in mid-March. Only ahead of a year ago by +20%. Tsk, tsk. Somewhat better than SPY. Since we don’t know much, we ask market-maker folks [MMs] who earn a very enviable living making bets about what can happen to those stocks. What do they think? Well, they don’t want us interfering as they help big-money fund clients move their portfolios’ million-dollar trade positions around, by putting the MM firm’s capital at risk. But as market-makers hedge those risks, they can’t help but tell us by their actions how big they think the risk prospects are – in both directions, down and up. The Risk~Reward Tradeoff Lives in Asia Too Some 15 ETFs focused on China find enough active trading among major big-money investment management organizations to create a continuing interest that can be tracked. Here is how their typical trading compares with that of our market-proxy tracker, the SPDR S&P 500 Trust ETF (NYSEARCA: SPY ): Figure 1 (click to enlarge) Figure 2 provides a comparison of how U.S.-based market-makers’ hedging forecasts upside prospects for these ETFs as of the Thursday 7/9/15 close, with the worst-case price drawdowns they have faced following forecasts similar to todays’. Figure 2 (used with permission) In this mapping upside price change prospects are scaled on the green horizontal and actual prior maximum price drawdowns following similar forecasts are on the red vertical scale. The dotted diagonal shows where the two conditions are equal. As a markets comparison SPY is at location [13]. Most China ETFs are either higher downside price risk or lower return, or both. The standout value of the moment appears to be the iShares China Large-Cap ETF (NYSEARCA: FXI ) at [7]. Further details on this and the other pictured ETFs are in the table of Figure 3. Figure 3 (click to enlarge) Of quick comparative interest should be the blue row summaries of Figure 3, comparing the present average MM perceptions of China ETFs with current-day data of U.S. and world equities. The 16 Chinese ETFs Offer larger upside forecasts (column 5) with nearly the same -6% average risk exposures (7). But their net gains achieved (9) from similar prior forecasts at +5% have been only half the size (+10.3%) of the 20 best of the 2584 population of measurable equities. Part of the difference comes from better recovery from price drawdowns back to profitable prices (8) of 86 out of each 100 for the 20, while the Chinese 16 were able to recover only 73 of each 100. Conclusion The best of the Chinese ETFs are competitive on a risk~reward tradeoff basis with the best of the larger population of equities, and absolutely squash the prospects of SPY in virtually every column comparison save for price drawdown risk exposure. In the non-leveraged Chinese ETFs, many are becoming attractive. Disclosure: I/we have no positions in any stocks mentioned, and no plans to initiate any positions within the next 72 hours. (More…) I wrote this article myself, and it expresses my own opinions. I am not receiving compensation for it (other than from Seeking Alpha). I have no business relationship with any company whose stock is mentioned in this article. Share this article with a colleague Scalper1 News
Scalper1 News