Tag Archives: fxi

A New Chinese ETF Is Better For An Arbitrage Or Just To Be Long Mainland China

Summary I’ve often written on the emerging spread between China-listed and Hong Kong-listed shares. This spread can form the basis of an arbitrage, but present ETFs have some problems in providing such arbitrage. However, there’s a new China ETF which might be better both for such an arbitrage and even just for a simple long for those wanting mainland China exposure. I’ve sometimes written about the widening gulf between Chinese shares quoted in Hong Kong (H shares) and their equivalents quoted in China’s Shanghai/Shenzhen exchanges (A shares). The last time I wrote about it was in my article titled ” There’s A Measure Of Irony In Today’s China Rally .” This spread between what are effectively the exact same shares started in November 2014, which coincided with the inception of a large bubble in Chinese stocks (quoted in China). One can follow this irrational spread by checking the Hang Seng China AH Premium Index and seeing how in years prior the index hovered in the 90-110 area as it should, and only recently it shot as high as 140-145. This means a basket of equivalent A shares is trading 40-45% above what their Hong-Kong quoted counterparts are going for. ( Source : FT.com ) I’ve said that a way to take advantage of this situation would be to arbitrage it by selling short an index fund composed of A shares and buying an index fund composed of H shares. My candidates for this were the Deutsche X-trackers Harvest CSI 300 China A-Shares ETF (NYSEARCA: ASHR ) for the short leg and the iShares China Large-Cap ETF (NYSEARCA: FXI ) for the long leg of the arbitrage. However, I’ve always had to warn that this is a very imperfect arbitrage, because the funds don’t have the same holdings – they just have some overlap where it matters. As such, this trade could only be taken for short periods of time, as any tracking error can accumulate over time. There Might Be A Better Way There is a new kind on the Chinese ETF block. I am talking about the CSOP China CSI 300 A-H Dynamic ETF (NYSEARCA: HAHA ). This ETF has unique characteristics, as follows: It replicates the CSI 300 Index, which is made up of A shares. However – and this is a key difference – whenever there’s an equivalent H share, and the H share is trading cheaper than its A share counterpart, the ETF buys the H share instead. Also, the fund carries a 75 bps expense ratio. And it’s managed by CSOP, which is the largest China A ETF manager globally, based in Hong Kong and with offices in New York. Due to the unique way this ETF is managed, it presents a much better way to implement the arbitrage I once used ASHR and FXI for. Here, the arbitrage would need to be structured as follows: A long position on HAHA. Together with a short position on ASHR, which tracks the CSI 300. The tracking error of this solution would be much smaller than the previous version, and it should correlate much better with changes to the Hang Seng China AH Premium Index. Furthermore, this ETF will probably also constitute a better alternative for those simply wanting direct exposure to China’s A share market/CSI 300. After all, it will include all of the necessary components, while also including the cheaper H shares if those are available. Not All Is Roses, Though There are a couple of issues which need to also be taken into account: HAHA is still a very recent and mostly unknown ETF, so its liquidity is very low. Furthermore, low liquidity can lead to large bid-ask spreads, much larger than either FXI’s or ASHR’s. This can be somewhat mitigated if the proper market makers tighten them, but at present, it’s clearly a problem, as it increases trading costs. Also, holding an ASHR short position, while being cheaper now, is still somewhat expensive. This is how the short rebate fee has evolved recently – as you can see, it still costs nearly 6%/year to keep an open short position: (click to enlarge) ( Source : Interactive Brokers) Conclusion There is a case to be made for using HAHA for an arbitrage to capture the Chinese A-H share spread in an arbitrage position. There is also a case to be made for using HAHA just to get long exposure to the Chinese CSI 300 index. However, a couple of problems remain in both cases, namely the lack of liquidity and thus larger trading costs, and the cost of keeping an ASHR short position open.
Where Will China Financial ETFs Go From Here?

The Chinese economy has been grappling with liquidity crunch for more than two years now. But the problem recently reached an alarming level. While high bad loan in a waning economy made it hard for the borrowers to repay loans, the surprise devaluation of yuan in mid August worsened the crisis. This led to net foreign exchange outflows worth 723.8 billion of yuan in August that crumpled the Chinese banking system. Chinese banks are on their way to see the worst year in 13 years, per Wall Street Journal. Most of banking bellwethers reported lackluster first-half performances this year. Some analysts including those of Moody’s expect Chinese banks’ profits to weaken further in the second half of this year hurt by piled up non-performing loans and fall in net interest margins. A plunge in fee income from stock-related services will also hit banking services hard as Chinese investments fell out of investors’ favor lately. Is There Any Hope? While the operating backdrop looks outright grim for the Chinese banks, a few recent developments could favor the bunch. First, despite the record monthly decrease in forex reserves, China had the biggest hoard of foreign reserves of $ 3.56 trillion at the end of last month. Added to this, the percentage of bad debt in total loans, though high from the last quarter, remained low by global averages. Moreover, after the summer slowdown and a scorching sell-off in August, Chinese banks are now trading at bargain. The price/book value of Industrial and Commercial Bank of China’s Hong Kong-listed stock is 0.8 times, reflecting a 72.4% discount from the level seen in 2009, per Wall Street Journal. Several other big banks are also showing the same downtrend. Of course this valuation pointer reflects bearish sentiments on these banking stocks. But on a positive note, it also indicates dirt cheap valuation for the Chinese banks. If this was not enough, the Chinese central bank appears to be going all out to infuse liquidity into the economy and cut rates and reserve requirement ratios (RRR), as it has done several times this year, to boost lending. China also relaxed the methods for computing the reserve requirement ratios of banks. Per the 17-year old rule, banks were required to tally their RRR on a daily basis. “Under the changes, banks can report a daily RRR that is up to 100 basis points lower than the rate set by the PBOC, but their daily average RRR in the assessed period cannot fall under the required level,” per Reuters . Per a report by Barrons.com , Nomura Securities approximates that this easing can free up to 1.3 trillion yuan, or 1% of total banking deposit. All these stimuli should result in higher lending which in turn should boost profits. Also, in August, total social financing rose 13% to 1.08 trillion and corporate-bond issuances more than doubled to 287.5 billion indicating that present activities may not be as bleak as it looks. In a nutshell, relentless efforts by policymakers to boost loan growth and compelling valuation should stage the backdrop for China ETFs with heavy allocation to the financial sector, at least for the near term. Since no one knows what’s exactly cooking up behind the Great Wall and how long does it will take the country to return to top gear, caution needs to be practiced while playing these products. Investors should note that the core China financial ETF, the Global X China Financial ETF (NYSEARCA: CHIX ) was one of the best performers in the China equities ETFs space in the last one-week, four-week and one-year periods (as of September 15, 2015). So, we highlight two finance-heavy China ETFs which have bottomed out and could turn around in the coming days. After all, China shares have been trending higher in recent sessions after a bloodbath and financial ETFs could very well cash in on this rising trend: ETF Plays Global X China Financial ETF This ETF provides concentrated exposure to the financial segment of Chinese equity market by tracking the Solactive China Financials Index. In total, the fund holds over 40 securities in its basket with the top three firms – China Construction Bank ( OTCPK:CICHF ), and Industrial & Commercial Bank of China ( OTCPK:IDCBY ) and Bank Of China ( OTCPK:BACHY ) – dominating the fund’s returns at more than 9% share each. It is a large cap centric fund accounting for 85% of assets. The fund has amassed $54.1 million in its asset base while trades in moderate volume of 150,000 shares per day on average. It charges 65 bps in annual fees and expenses. The fund is presently trading at a P/E (ttm) of 7 times, suggesting an appealing valuation. The fund was up about 9% in the last one week (as of September 15, 2015) and has a Zacks ETF Rank of 3 or ‘Hold’ rating with a Medium risk outlook. iShares China Large-Cap ETF (NYSEARCA: FXI ) This is easily the most popular China ETF in the market, as over $5.7 billion is invested in the fund and average daily volume is over 30 million shares a day. The 51-stock product puts half of its weight in the financial sector. This means that any news out of the financial sector can have a huge impact on the overall return of this famous ETF. China Construction Bank Corp, Industrial & Commercial Bank of China and Bank of China Ltd. are among the top-five holdings. FXI charges 74 bps in fees and has P/E (ttm) of 9 times. The ETF added about 7.2% in the last five trading sessions and has a Zacks ETF Rank #3. Link to the original post on Zacks.com

What Greece And China Teach Us About Investing

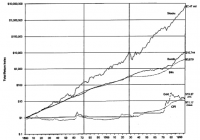
By Andy Rachleff It’s been a crazy couple of weeks for the investing world. China’s stock market – after one of the biggest run-ups of any market in history – has suffered a 40% collapse in just a few weeks. Greece has teetered on the brink of default, and still may or may not exit the euro. The U.S. has drawn up a major new deal with Iran, oil is down sharply, and Indian stocks are rallying like mad. What should an investor do? In a word: Nothing. If there’s anything that the day-by-day machinations of the market teach us, it is that slow and steady wins the race. The Incredible Mean-Reverting Nature of Stock Returns Investors have long known that staying the course is one of the most important things to do. Some of the best research on this topic comes from the so-called “Wizard of Wharton” – University of Pennsylvania professor Jeremy Siegel. In his New York Times bestselling book, ” Stocks for the Long Run ,” Siegel looked at the performance of equities from 1802 through 1997, the year the book was first published. His findings were astonishing: Despite the day-to-day volatility that we all feel, the actual long-run returns of stocks are remarkably consistent. Here’s how Siegel summarized his findings: ” Despite extraordinary changes in the economic, social, and political environment over the past two centuries, stocks have yielded between 6.6 and 7.2 percent per year after inflation in all major subperiods. The wiggles on the stock return line represent the bull and bear markets that equities have suffered throughout history. The long-term perspective radically changes one’s view of the risk of stocks. The short-term fluctuations in market, which loom so large to investors, have little to do with the long-term accumulation of wealth. ” His last line bears repeating: ” The short-term fluctuations in market, which loom so large to investors, have little to do with the long-term accumulation of wealth. ” Siegel found that almost no matter what period you looked at, stocks delivered about 7% after inflation. The Civil War, World War I, World War II, even the Great Depression (marked by the second black vertical line) were hiccups compared to the overall trend. The pattern repeats in other countries, including those that have experienced catastrophic collapses. World War II, for example, sheared 90% off the value of German equities… but German stocks completely rebounded by 1958, rising 30% per year, on average, from 1948 to 1960. They went on from there to new highs. Averaged out over the long haul, their return is a consistent 6.6% real return… a figure that continues through this day. The same is true for Japan, the UK, and all other markets that Siegel has studied; in the short run, volatility, but in the long run, profits. Can’t We Just Side-Step the Disaster Spots? Of course, the best possible outcome would be to steer clear of pullbacks, selling when markets are about to collapse and buying when they start to recover. This is the marketing pitch used by virtually every active manager in the world, and it is intuitively compelling. “Greece has been a disaster for years,” you can’t help but think. “Surely, if I had been paying attention, I would have sold and avoided its recent fall.” “China’s stock market was clearly a bubble,” you ponder. “The economy is slowing; reforms are stagnating; any idiot would have sold out before things got bad!” Unfortunately, the data shows that even highly-paid professionals are bad at sidestepping these pullbacks, and everyday investors are worse. As mentioned repeatedly on this blog, every piece of significant data shows that the vast majority of active mutual fund managers underperform the market over any meaningful period of time. Despite all their highly-paid analysts and fancy data services, they can’t beat a broad-based index. But the dirty little secret is, as bad as professional money managers are at beating the market, retail investors – on average – do worse. In a major study published in February 2015 , Morningstar looked at the difference between the average return of mutual funds and the actual returns that investors enjoyed. The data is brutal: While the average U.S. equity mutual fund returned 8.18% for the decade ending December 31, 2013, the average dollar invested in U.S. equity funds returned just 6.52%. For international equity funds, the situation was worse: an 8.77% return for the average fund, but a 5.76% return for investors. (click to enlarge) John Reckenthaler, the vice president of research at Morningstar, explained what was happening in Barron’s last year. “The problem,” the magazine wrote, summarizing his comments, “is that investors tend to get in and out of an asset class at the wrong time.” In other words, we tend to buy high and sell low. The problem is worse in the more volatile asset classes, ostensibly because we’re more likely to panic. (It’s not just Morningstar. DALBAR conducts an annual study that looks at the same effect over rolling twenty-year periods. Its last finding shows that investors underperformed the market by 4.2% per year over the past twenty years.) Don’t Buy What They’re Selling The reason we don’t hear much about the power of long-term investing – and the truth about the futility of trading – is that long-term investing is boring and it’s cheap. The financial media thrives by encouraging you to panic, and large parts of the financial industry make money only when you act. Big moves sell newspapers, and high trading activity means commissions for online brokers. The only people who don’t profit from that activity are investors themselves, because as it turns out, we can’t predict the future. Even as we finalize this post, Greece is possibly stabilizing, Chinese stocks have evened out and the crisis-du-jour involves gold. Did you see that coming? Do you know what comes next? It’s hard to stare down a significant market correction and stick to your plan. When the US government shut down in September 2013 during the budget showdown, we saw a large number of clients refrain from continuing to add deposits. They paid handsomely for missing out on the rebound. If you invest regularly, harvest your losses and rebalance your portfolio, you’ll end up benefiting from market corrections in multiple ways. It won’t be easy. But over the long haul, it will really pay off. For more on this topic please read: Stay the Course, Even While You’re Down There’s No Need to Fear Stock Market Corrections Invest Despite Volatility Disclosure Nothing in this article should be construed as a tax advice, solicitation or offer, or recommendation, to buy or sell any security. While the data Wealthfront uses from third parties is believed to be reliable, Wealthfront does not guarantee the accuracy of the information. The analysis uses information from third-party sources, which Wealthfront believes to be, however Wealthfront does not guarantee the accuracy of the information. There is a potential for loss as well as gain. Actual investors on Wealthfront may experience different results from the results shown. Andy is Wealthfront’s co-founder and its first CEO. He is now serving as Chairman of Wealthfront’s board and company Ambassador. A co-founder and former General Partner of venture capital firm Benchmark Capital, Andy is on the faculty of the Stanford Graduate School of Business, where he teaches a variety of courses on technology entrepreneurship. He also serves on the Board of Trustees of the University of Pennsylvania and is the Vice Chairman of their endowment investment committee. Andy earned his BS from the University of Pennsylvania and his M.B.A. from Stanford Graduate School of Business.