Scalper1 News
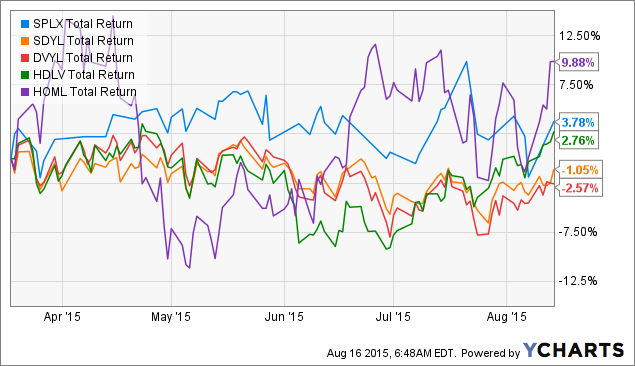
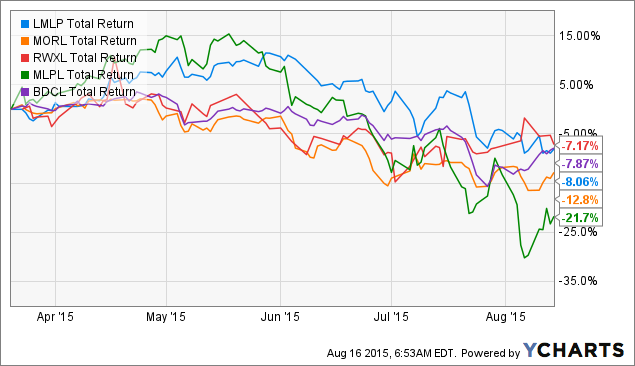
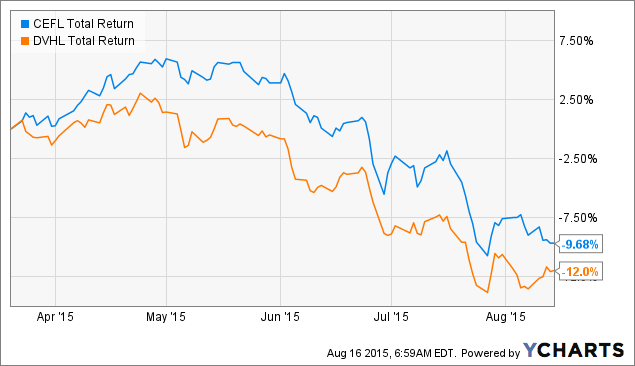
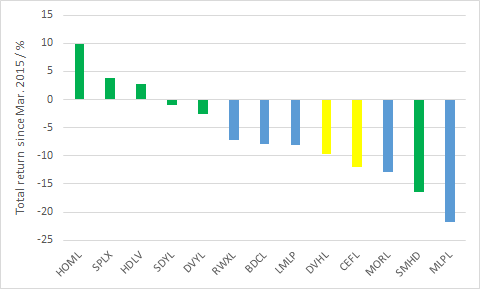
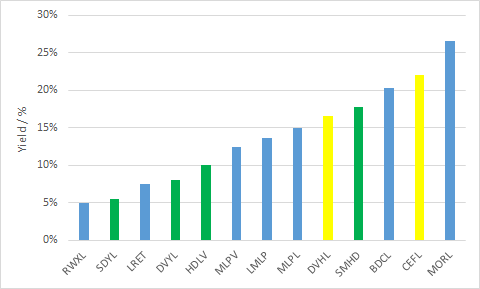
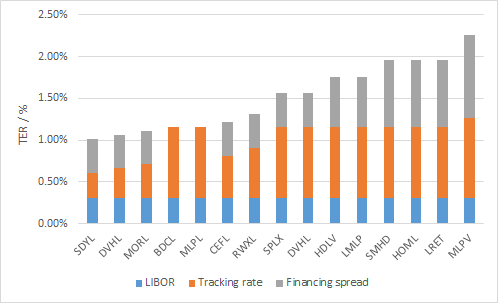
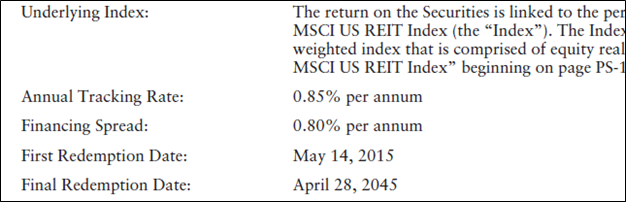
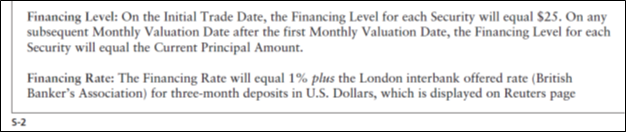 Summary Since my last article, UBS has launched two more 2X Leveraged ETRACS ETNs. The mid-year spike in interest rates has pulled down many of these income-generating funds to more attractive levels. Relevant data for all of the funds are updated. Introduction In a Mar. 2015 article entitled ” A Quick Overview Of UBS ETRACS 2X Leveraged ETNs “, I gave a brief introduction to the line-up of 2X leveraged ETNs offered by UBS (NYSE: UBS ). These ETNs cover a broad range of investment classes, including traditional equity as well as alternative investment types such as real estate investment trusts [REITs], mortgage REITs [mREITs], master limited partnerships [MLPs], business development companies [BDCs] and closed-end funds [CEFs]. The use of 2X leverage allows these ETNs to offering alluring headline yields. For further general information regarding the pros and cons of leverage, as well as specific risks regarding these ETNs, please see my previous article . New offerings In May 2015, UBS launched the ETRACS Monthly Pay 2xLeveraged MSCI US REIT Index ETN (NYSEARCA: LRET ), an ETN that tracks twice the monthly return of the MSCI US REIT Index (the same index tracked by the giant Vanguard REIT ETF (NYSEARCA: VNQ )). LRET charges 1.96% in total fees (see below for how this is calculated), and sports a headline 2X index yield of 7.45%. In July 2015, UBS launched ETRACS 2xMonthly Leveraged S&P MLP Index ETN (NYSEARCA: MLPV ), which tracks twice the monthly return of the S&P MLP index. MLPV charges 2.26 in total fees, and sports a headline 2X index yield of 12.49%. The funds UBS currently offers fifteen 2X leveraged ETNs. The following table shows the fund name, ticker symbol, 12-month trailing yield, inception date, the corresponding 1X leveraged fund (where available), average trading volume and total expense ratio [TER] of the ETNs. The TERs were obtained from the funds’ pricing supplements and the remaining data are from Morningstar . Where 12-month trailing yields are not available (for more recent launches), the 2X index yield provided by UBS has been presented. UBS engages in the (rather dubious, in my opinion) practice of hiding their financing spread within their pricing supplement, which makes their headline management fee (known as “tracking rate”) look lower. For example, the UBS ETRACS Monthly Pay 2x Leveraged S&P Dividend ETN (NYSEARCA: SDYL ) has an annual tracking rate of 0.30%, a figure that is displayed prominently on the fund’s website, but you have to dig into the pricing supplement to see that you are being charged an additional 0.40% financing spread, which means that the total financing rate will be 0.40% + 3-month LIBOR (currently 0.31%). Adding all three fees together gives a total expense ratio of 0.30% (tracking rate) + 0.40% (financing spread) + 0.31% (3-month LIBOR) = 1.01%. Since LIBOR is subject to change, in my previous article I excluded LIBOR when quoting the TER of the funds (while reminding readers to be aware of this expense). However, in this article I have decided to quote TER to be inclusive of LIBOR (currently 0.31%) to give investors a better idea of the total fees that are currently paying. Additionally, note that because the funds are 2X leveraged, one should divide the TER by two if one wish to compare the expense ratios with unleveraged funds. I have also rearranged the categories of the funds somewhat compared to the last article. All broad equity, dividend equity, small-cap equity and homebuilder equity ETNs are grouped under “Equity”. The “Alternative Equity” class includes MLP, REIT, mREIT, and BDC funds. “Balanced” includes CEF and multi-asset funds. Fund Ticker Yield Inception Volume TER* 1X Alternative Equity Monthly Reset 2xLeveraged S&P 500 Total Return ETN (NYSEARCA: SPLX ) N/A(1) 3/2014 9K 1.56% SPDR S&P 500 Trust ETF (NYSEARCA: SPY ) Monthly Pay 2xLeveraged S&P Dividend ETN SDYL 5.43% 5/2012 1.8K 1.01% SPDR Dividend ETF (NYSEARCA: SDY ) Monthly Pay 2xLeveraged Dow Jones Select Dividend Index ETN (NYSEARCA: DVYL ) 8.09% 5/2012 8K 1.06% iShares Select Dividend ETF (NYSEARCA: DVY ) Monthly Pay 2xLeveraged US High Dividend Low Volatility ETN (NYSEARCA: HDLV ) 10.02%^ 9/2014 15K 1.76% Monthly Pay 2xLeveraged US Small Cap High Dividend ETN (NYSEARCA: SMHD ) 17.70%^ 3/2015 23K 1.96% Monthly Reset 2xLeveraged ISE Exclusively Homebuilders ETN (NYSEARCA: HOML ) N/A(1) 3/2015 23K 1.96% ISE Exclusively Homebuilders ETN (NYSEARCA: HOMX ) Alternative Equity Monthly Pay 2xLeveraged Wells Fargo MLP Ex-Energy ETN (NYSEARCA: LMLP ) 13.56% 6/2014 23K 1.76% Wells Fargo MLP Ex-Energy ETN (NYSEARCA: FMLP ) Monthly Pay 2xLeveraged MSCI US REIT Index ETN LRET 7.45%^ 5/2015 63K 1.96% Vanguard REIT ETF [VNQ] Monthly Pay 2xLeveraged Mortgage REIT ETN (NYSEARCA: MORL ) 26.52% 10/2012 289K 1.11% Market Vectors Mortgage REIT Income ETF (NYSEARCA: MORT ) Monthly Pay 2xLeveraged Dow Jones International Real Estate ETN (NYSEARCA: RWXL ) 4.99% 3/2012 24K 1.31% SPDR Dow Jones International Real Estate ETF (NYSEARCA: RWX ) 2xMonthly Leveraged Long Alerian MLP Infrastructure Index ETN (NYSEARCA: MLPL ) 15.02% 7/2010 103K 1.16% Alerian MLP Infrastructure Index ETN (NYSEARCA: MLPI ) & ALPS Alerian MLP ETF (NYSEARCA: AMLP ) 2xMonthly Leveraged S&P MLP Index ETN MLPV 12.49%^ 7/2015 1.6K 2.26% iPath S&P MLP ETN (NYSEARCA: IMLP ) 2xLeveraged Long Wells Fargo Business Development Company Index ETN (NYSEARCA: BDCL ) 20.24% 5/2011 164K 1.16% Wells Fargo Business Development Company ETN (NYSEARCA: BDCS ) Balanced Monthly Pay 2xLeveraged Closed-End Fund ETN (NYSEARCA: CEFL ) 22.04% 12/2013 150K 1.21% YieldShares High Income ETF (NYSEARCA: YYY ) Monthly Pay 2xLeveraged Diversified High Income ETN (NYSEARCA: DVHL ) 16.56% 11/2013 15K 1.56% Diversified High Income ETN (NYSEARCA: DVHI ) * Includes 3-month LIBOR (currently 0.31%). ^ 2X index yield provided by fund sponsor. Actual yield may be different. (1) No dividends are paid out as this is a total return fund. Recent performance A chart of the total return performance of the 6 equity-based 2X leveraged ETNs (excluding SMHD, which for some reason doesn’t show on YCharts) since my last article is presented below. SPLX Total Return Price data by YCharts The graph above shows that the 2X homebuilder ETN HOML has outperformed with a total return of 9.88% since Mar. 2010, followed by SPLX with 3.78%. HDLV had a slight positive return of 2.76%, while the two “vanilla” dividend ETNs, SDYL and DVYL, had the lowest total returns of -1.05% and -2.57%, respectively. However, if SMHD had been included in this graph, it would have been by far the worst-performing fund, with a total loss exceeding -15%. A chart of the total return performance of the 7 alternative equity-based 2X leveraged ETNs (excluding LRET and MLPV whose histories are too short) since my last article is presented below. LMLP Total Return Price data by YCharts Unfortunately, all five of the alternative equity ETNs shown in the chart have had negative returns since Mar. 2015. This is not surprising because many of these asset types are considered to be income-generating vehicles that suffered significantly during the interest rate spike in the first half of 2015. MLPL had the worst total return of -21.7%, a consequence of collapsing oil prices, while MORL had the second-lowest total return of -12.8%. The best (relative) performance was turned in by the 2X international real estate ETN RWXL, at -7.17%, followed by BDCL at -7.87%. LMLP had a total return of -8.06% over this period. Finally, a chart of the total return performance of the 2 balanced 2X leveraged ETNs since my last article is presented below. CEFL Total Return Price data by YCharts We can see from the chart above that CEFL had a total return of -9.68% while DVHL had a total return of -12.0%. The total return performances of the 2X leveraged ETNs since Mar. 2015 is shown in the chart below, arranged in order of highest to lowest return. Equity funds are in green, alternative equity funds are in blue, and balanced funds are in yellow. We can see from the chart above that the equity ETNs have had the best total return performances since Mar. 2015. In fact, the five best-performing funds were all equity ETNs. The notable exception of this class was SMHD, which performed poorly. Distributions Most of the funds have “Monthly Pay” in their title, and therefore these funds pay monthly. BDCL, MLPL and MLPV pay quarterly, while SPLX and HOML are total return funds and so they pay out nothing at all. However, investors should be aware that the monthly payments can be quite lumpy. This is especially true when the majority of the underlying constituents of the fund pay quarterly dividends on the same month. An extreme example is MORL, where the “big month” distributions are approximately 10 times as large as the two “small month” distributions. The yields of the funds are also displayed graphically below, arranged in order of smallest to highest yield. Equity funds are in green, alternative equity funds are in blue, and balanced funds are in yellow. We can see from the graph above that MORL has the highest yield, at 26.52%, while CEFL and BDCL have the second and third-highest yields of 22.04% and 20.24%, respectively. At the other end of the spectrum, RXWL, SDYL and LRET have the lowest yields of 4.99%, 5.43% and 7.45%, respectively. Expense ratios As explained above, the headline expense ratio (or “tracking rate”) stated on the UBS website for the ETRACS products is not the total fee charged by the ETNs. One must delve into the pricing supplement to ascertain the additional “financing spread” charged by the issuer. The sum of the two expense ratios is then added to the 3-month LIBOR (currently 0.31%) to calculate the TER of the funds. Additionally, and as mentioned above, the TER should be divided by two if one wishes to compare the expense ratios of these ETNs to non-leveraged funds. The TERs ( including 3-month LIBOR, currently 0.31%) of the funds is also depicted graphically below, from lowest to highest. The breakdown of the TERs are also shown. In my previous article, I wrote that: Finally, we observe that the TERs of the funds span a wide range of values, from 0.80% to 1.65%, with the somewhat unsettling observation that the more recent funds have been launched with higher expense ratios. That statement turned out to be somewhat prophetic as the two funds launched since my last article, LRET and MLPV, have the highest TERs of 1.96% and 2.26%, respectively (HOML and SMHD, two other recent launches, are tied for second at 1.96%). For LRET, the financing spread is shown in the “pricing supplement”, which can be accessed from the fund website : (click to enlarge) For the newest launch, MLPV, there is no pricing supplement. This was the case for two of UBS’ earliest funds, BDCL and MLPL, who do not possess the veiled financing spread. I was ecstatic. I thought “maybe UBS was reading my articles that shed light on their shenanigans and finally decided to lower their expense ratios for the benefit of their investors.” Alas, I was wrong. Instead of a pricing supplement, the financing spread was detailed, for the first time, in the prospectus supplement, which can be accessed from the fund website . The cynic in me thinks that the reason that UBS moved the financing spread from their pricing supplement to their prospectus supplement is to further obfuscate investors about the presence of said spread. After all, why would someone invest in their new launch MLPV, which charges 2.26% in expense ratio, when they could invest in the similar 2X leveraged MLP ETN MLPL, which charges only 1.16% in fees? However, the unwitting investor would not know about this difference because the headline tracking rate displayed for MLPV (0.95%) is only 0.10% higher than that for MLPL (0.85%). I therefore call on UBS to display all relevant expenses clearly on their fund website instead of in fine print within the pricing or product supplements. Conclusion The 2X leveraged funds allow investors to obtain leveraged participation in traditional equity as well as alternative equity classes such as REITs, mREITs, BDCs, MLPs and CEFs. For the average investor, this leverage can be obtained much more cheaply compared to a margin loan from a broker. For example, for the smallest account size, Charles Schwab (NYSE: SCHW ) charges 8.50%, Fidelity 8.575%, Scottrade 7.75%, Merrill Edge 8.625%. Only Interactive Brokers (NASDAQ: IBKR ) (which I use) offers a competitive margin rate at 1.61% for their smallest accounts. This article also provides an update on the two newest issues, LRET and MLPV. Regrettably, the expense ratios of these two funds are the highest or tied-highest of all the ETNs launched so far. While several of these leveraged ETNs offer sky-high yields, investors need to be aware of the drawbacks of these funds, which include leverage decay (which is somewhat ameliorated by the monthly reset), significant expense ratios and credit risk of the fund sponsor [UBS]. Of course, these risks are on top of the inherent risks of investing in each asset class. For example, MLPs are sensitive to commodity prices while REITs/mREITs are sensitive to interest rates. Interested readers may also consult my recent articles on HDLV and CEFL . Disclosure: I am/we are long CEFL, BDCL, MLPL, MORL, LMLP. (More…) I wrote this article myself, and it expresses my own opinions. I am not receiving compensation for it (other than from Seeking Alpha). I have no business relationship with any company whose stock is mentioned in this article. Scalper1 News
Scalper1 News