Scalper1 News
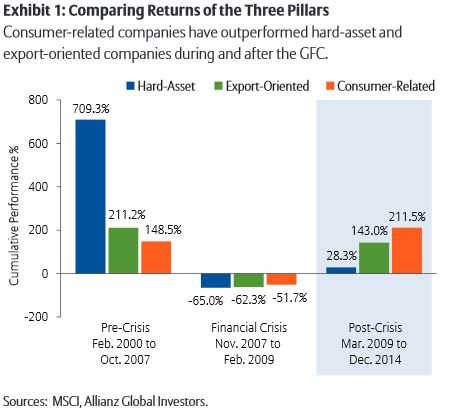
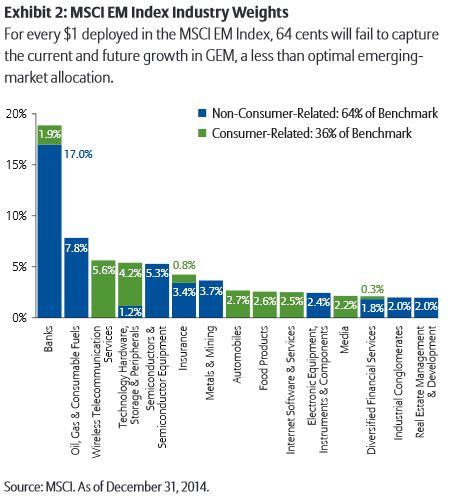
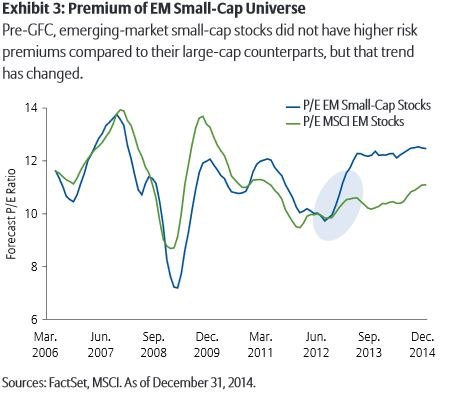
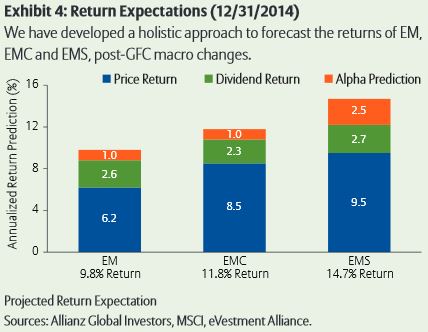
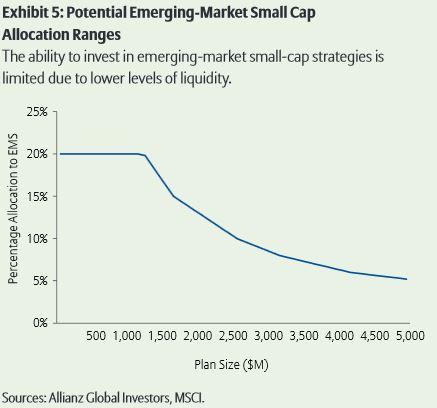
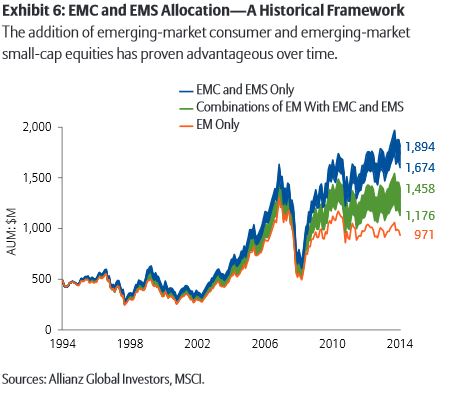
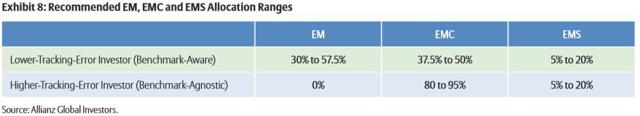
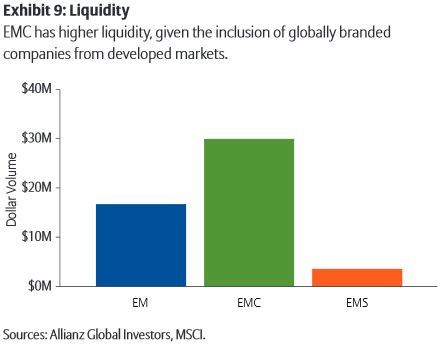
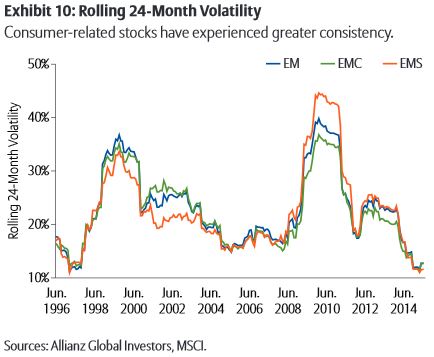 Summary The secular EM transformation merits separate allocations to EM consumer-related and EM small-cap strategies, which are better positioned to capture current and future growth within EM economies. Our analysis indicates that benchmark-aware investors with limited tracking error budgets should consider a standard EM exposure of 30%-57.5%, with 37.5%-50% in EM consumer and 5%-20% in EM small cap. However, benchmark-agnostic investors should consider an exclusive allocation of 80%-95% to EM consumer, and 5%-20% for EM small cap. The latter allocation allows investors to potentially preserve significant capital in down markets, while possibly providing similar or better upmarket returns relative to the MSCI EM Index. By the Allianz Global Investors Systematic Investment team Introduction At the beginning of this century, global emerging markets came into vogue as a new investable asset class. Attracted by near double-digit gross domestic product growth, investors allocated billions of dollars to GEM strategies and were rewarded with double-digit annualized returns. However, over the last five years, GEM investors have been frustrated as the MSCI EM Index has under- performed the developed-market index-represented by the MSCI World Index-by 56%. 1 To add to their agony, the GDP growth of GEM economies over the same time period was 4.5%, significantly higher than the anemic 0.9% 2 GDP growth in developed-market economies. To understand this underperformance, we need to review the changes at work in emerging economies and the underlying problems of the MSCI EM Index. Market decoupling and growth of the emerging-market consumer The global financial crisis of 2007-2008 forced a secular change In the growth dynamics for both developed markets and GEM. Pre-GFC, growth for GEM was largely driven by two factors: manufacturing exports to developed markets, primarily the US and Europe; and domestically focused fixed-asset investment programs-dubbed “hard assets”-for infrastructure development in countries like China and Brazil. This model lost its steam during the GFC, when consumers in developed countries started deleveraging and China stopped aggressive building. In a previous white paper, 3 we argued that the investment-driven growth model in GEM is permanently impaired, and that a rebalancing is underway toward a more consumption-driven growth model for a multitude of reasons. In contrast, the double-digit real wage growth experienced in GEM over the last 10 years has left the local consumer with higher disposable income and an increased appetite for consumer goods. This pattern of consumption growth parallels that of the Japanese consumer from 1960-1990, and that of the US consumer from 1980-2007. However, the magnitude of consumption spending from the emerging-market consumer is expected to dwarf that seen in either of these two prior consumption cycles. The emerging-market consumption cycle is expected to be $10 trillion by 2020, compared to $7 trillion for the US in 2007. 4 Exhibit 1 compares returns of the three groups of companies associated with the three pillars of an economy: hard-asset, export- oriented and consumer-related. Before the GFC, companies with a business model aligned with hard-asset investment-primarily commodity, energy and real-estate companies-demonstrated the highest returns, followed by export-oriented companies; domestic consumer-related stocks were the relative laggards. The story turned 180 degrees during and after the GFC, as consumer-led companies outperformed the other two groups. However, it is important to note that market-capitalization-weighted indices are designed to be representative of an economy’s recent past achievements. Companies aligned with the most successful parts of the economy demonstrate higher earnings growth; these companies are rewarded by investors with share price appreciation and, in turn, eventually become larger components of an index. The overall lack of any forward-looking perspective from these indices becomes apparent when an economy goes through a disruptive change, as seen with GEM countries during and after the GFC. As a result, the MSCI EM Index is no longer the best proxy for capturing the economic growth and equity value creation in GEM. As highlighted in Exhibit 2 , for every $1 deployed in the MSCI EM Index, 64 cents will fail to capture the current and future growth in GEM-a less than optimal emerging-market allocation. We propose that an emerging-market consumer strategy can address the structural disconnect between GEM economies and the MSCI EM Index. As such, investors may want to consider allocating a portion of capital away from traditional index-oriented emerging-market strategies, and toward dedicated consumer strategies that stand to benefit from current and future consumption trends. Our suggestion is to include stocks in segments with direct consumer-related demand, such as consumer discretionary, consumer staples, health care, wireless telecommunications, automobiles, media, airlines, etc. We also advocate the inclusion of select globally branded securities in developed markets, which increasingly capture demand from the local emerging-market consumer. Finally, we recommend the avoidance of energy, utilities and materials stocks, which largely cater to demand from developed markets. The resulting portfolio may then be more directly aligned to the significant consumption growth of emerging-market economies. Increasing appetite for emerging-market small cap Before the GFC, investors essentially ignored a separate allocation to emerging-market small-cap stocks. Academic research shows that developed-market small-cap equity indices typically offer outsized earnings growth and a higher risk premium than their large-cap counterparts. As a result, institutional portfolios typically maintain a dedicated small-cap allocation in the US, EAFE and world markets. However, this observation was not true with emerging-market small-cap stocks, which historically had not demonstrated higher earnings growth to warrant a multiple premium. Exhibit 3 shows the forecast P/E ratio of emerging-market small-cap stocks was in line with, or even traded at a discount to, their large-cap counterparts. Since 2012, however, investors have witnessed superior earnings growth from emerging-market small-cap stocks; as a result, emerging small-cap stocks have started showing higher multiples along with improved liquidity. Furthermore, an emerging-market small-cap allocation also tends to better encapsulate demand at the local level-providing a backdoor way for investors to capture the decoupling between developed markets and GEM as market-demand patterns diverge. With more than 4,000 securities, the emerging-market small-cap universe has a level of information flow and analyst coverage that varies, from essentially non-existent, to the level often associated with larger-cap stocks. The unmatched inefficiencies in emerging-market small-cap equities have led to higher outperformance potential for active management, resulting in a benchmark that consistently ranked in the 4th quartile, and the median manager outperforming the benchmark by over 5.4% on an annualized five-year basis. 5 The combined asset-class inefficiencies, alongside higher institutional and retail asset flows, have also translated into an increased risk premium for the emerging-market small-cap asset class, as shown in Exhibit 3 Allocation considerations for EM, EMC and EMS We believe that the undeniable economic transformation in emerging markets warrants a separate allocation to a consumer-related strategy, and that vast inefficiencies and high alpha potential merit an allocation to an emerging-market small-cap strategy. The question is, how should investors thoughtfully allocate between these strategies? The goal of this paper is to develop a simple set of criteria that will help an investor allocate capital between a standard emerging market, emerging-market consumer and emerging-market small-cap strategies. Since asset-allocation targets will vary among investors based on their risk-tolerance levels and liquidity requirements, we are not so bold as to project a single allocation and declare it optimal. Instead, we consider three key criteria-return expectations, liquidity and volatility-and use them as guiding principles to help design an asset-allocation framework that is specifically built for investors who are seeking ranges of prudent and risk-efficient emerging-market allocations. Return expectations As highlighted earlier in this paper, we believe that the substantial changes in the post-GFC macroeconomic environment make it unwise to use past returns to extrapolate future returns. Instead, we have developed a holistic approach to forecast the returns of the three applicable asset classes: EM, EMC and EMS. To minimize any modeling error, as shown in Exhibit 4 , we limited our forecast to simple price return and dividend return, and used them to predict the total return of the three asset classes over the next five years. In addition, since emerging-market strategies have less institutional presence and the inefficiency in this market is significantly higher than in developed markets, our view is that no emerging-market return forecast is complete without considering an embedded alpha forecast. (For more information about this chart, click here .) Liquidity We define liquidity as the dollar volume of shares that are available to trade, without causing a distortion of prices or leaving a lasting market impact. We suggest liquidity is a greater concern when the investor desires to withdraw the capital, often during times of heightened market volatility. Liquidity will be low in times of high volatility, and liquidity will be high in times of low volatility. Exhibit 5 shows the relationship between an EMS allocation and the overall mandate size, which demonstrates a linear decline in the percentage of the emerging-market allocation to EMS once a plan crosses over the $1.2 billion threshold. While smaller plan sizes are not constrained by liquidity, we suggest the volatility and small-cap bias allow for a maximum allocation of 20% in EMS. For large plans with more than $5 billion in assets, we suggest that no more than 5% of the emerging-market allocation should be invested in EMS. Volatility We recognize that forecasting volatility with any degree of precision is beyond challenging. As a result, our risk predictions are limited to using historical volatility. For this white paper, we used rolling 24-month volatility to assess the risk of each of the three strategies. The risk for EM and EMS has been similar over time-although impacted by paradigm changes during the measurement period-whereas the EMC strategy typically offers lower volatility, especially in the post-GFC environment. This is the result of greater demand consistency and better earnings visibility for consumer companies, which is reflected in the volatility of stock prices. Grabbing the bull by the horns: The emerging-market asset-allocation decision Using the criteria of return expectations, liquidity and volatility, we developed various asset-allocation scenarios to emulate the client decision-making process and potential investment results. As demonstrated earlier, the EMS strategy has the highest potential return, but is by far the most limited when considering liquidity; as a result, it represents the biggest bottleneck from an asset-allocation perspective. As such, to be comprehensive and address potential underlying liquidity considerations, we considered three levels for an EMS allocation: a minimum allocation of 5%, an intermediate level of 10% and a maximum allocation of 20%. With the EMS allocation pegged between 5% and 20%, we considered varying allocations between EM and EMC, including three extreme scenarios that comprise only EMC and EMS. 6 Return potential across multiple allocation scenarios Using history as a reference point, we show in Exhibit 6 the cumulative growth of a $500 million emerging-market allocation across 20 different scenarios. The addition of EMC and EMS outpaces the total return performance regardless of the allocation mix; this is shown by the green band, which is consistently above the EM return, which is shown by the orange line. In addition, an exclusive mix of EMC and EMS, as shown by the blue band, produces the best cumulative return over the last 20 years. Our expectation is that this historical framework can be used as a guide for the future, given the higher return expectations for both EMC and EMS. This allocation mix also benefits from the lower forecast volatility of EMC, which has very different market participation, as consumer stocks tend to be more defensive and help protect on the downside, due to greater demand consistency. Keep in mind that these allocation scenarios represent past benchmark observations, and do not account for any investment manager expertise, including higher alpha potential or risk-mitigation techniques. Tracking-error considerations The above allocation scenarios should to be considered through the lens of tracking error, as most asset allocators will be measured on their decisions, relative to the predominate EM benchmark. The best down-market protection compared to the MSCI EM Index is achievable when an investor uses only an EMS and EMC allocation. This comes with high tracking error in the 8% to 9% range, but it could potentially provide 4% to 5% in relative returns when the emerging-market index tumbles 30%-equal to approximately 83% of the down-market capture. Substitution of some of the EMC allocation with EM reduces the tracking error with respect to the MSCI EM Index, but at the same time, it provides less protection in down markets. We believe that an investor who chooses any of the above allocations in lieu of a more typical emerging-market allocation should expect lower volatility and better down-market protection, with similar to slightly better up-market performance. Conclusion Our recommended ranges for EM, EMC and EMS are largely dependent on the investor’s willingness and ability to differentiate from the benchmark. At one extreme, benchmark-aware investors will likely have mandate guidelines that favor a small deviation from the MSCI EM Index. These investors should consider using a mix of EM and EMC stocks-with likely a smaller portion in EMS-to balance their return, tracking-error and volatility objectives. As shown in Exhibit 8 , for benchmark-agnostic investors who seek to maximize returns and can likely endure large deviations from the MSCI EM Index, we recommend focusing solely on EMC and EMS. The resulting emerging-market equity exposure will be a forward-looking portfolio better aligned with the economic engine in emerging markets-with potentially lower volatility, better down-market protection and similar or better performance in up markets. (click to enlarge) We believe that the environment for emerging markets has permanently changed. No longer is this asset class primarily dependent on demand from developed markets. Instead, the rapid growth potential of the emerging-market consumer and budding emerging-market small-cap opportunity set has drastically altered the game. Investors can wait for the benchmarks to gradually evolve-and for the weights for emerging-market consumer and emerging-market small-cap equities to increase over time-or they can proactively adjust their equity allocations to get ahead of the important changes occurring within the asset class. We suggest now is the time to grab the bull by the horns and thoughtfully allocate capital between emerging-market, emerging-market consumer and emerging-market small-cap strategies. Appendix Return prediction methodology Price return : We used the IBES Long-Term Growth Forecast with a Bayesian shrinkage applied to estimate price return among the three emerging-market strategies. By using only forecast earnings growth, we make a conservative assumption that there will be no multiple expansion, and that stocks will continue trading at their current price-to earnings levels. As seen in Exhibit 4 , the EMS allocation is expected to demonstrate a 53% higher annualized growth rate, (6.2% vs 9.5%) over the emerging-market index over the next 5 years. In terms of EMC relative to EM, the difference in earnings growth reflects the lower growth expectations from hard-asset and export-oriented companies which are excluded from an EMC allocation. Dividend return : We used the MSCI’s estimated payout ratio to calculate the dividend yield return. Dividends tend to be stable over time, which suggests the use of current dividends to extrapolate future expectations is warranted. Dividends have constituted a significant part of historical emerging-market returns, and we anticipate that as the asset class matures, dividends will become increasingly more important in total return expectations. Alpha prediction : When forecasting alpha over the index return we erred on the side of being conservative. We assumed that an investor can select a manager who will deliver an excess return at least equal to that of the median manager in that category. We used the median manager outperformance from the eVestment Alliance database over the last five years as our estimate and reduced that figure by one-third to acknowledge the increase in efficiency and the expected decline in alpha. 7 As EMC is essentially a subset of EM, we assumed the alpha for the two strategies to be the same. Total return : The total return expectation is the arithmetic sum of the price return, dividend return and alpha prediction, as shown in Exhibit 4 . Liquidity analysis A conservative trading strategy ensures that the total volume of shares traded should not exceed more than half of the daily liquidity while not owning more than three days of the overall market liquidity. We combine these daily liquidity and overall market liquidity constraints using median volume. While asset-allocation decisions should typically be independent of the size of the overall mandate, the low liquidity of EMS constrains the allocation regardless of the market environment and plan size as shown in Exhibit 9 . 8 It is also important to note the higher relative liquidity in EMC, which is due to the inclusion of preeminent, globally branded developed-market companies in the investment universe. Volatility analysis Historical volatility suggests that the earlier part of the decade, EMS demonstrated lower volatility due in part to lack of investor attention. This has since changed over the last several years, particularly during and after the GFC. EMC tends to demonstrate lower volatility than EM, as shown in Exhibit 10 , due in part to the great demand consistency demonstrated by local consumers, alongside the avoidance of cyclical stocks which cater to oscillating demand from the developed world. Additional Information For endnotes and additional information about this article, click here . Disclosure: I/we have no positions in any stocks mentioned, and no plans to initiate any positions within the next 72 hours. (More…) I wrote this article myself, and it expresses my own opinions. I am not receiving compensation for it. I have no business relationship with any company whose stock is mentioned in this article. Scalper1 News
Scalper1 News