Scalper1 News
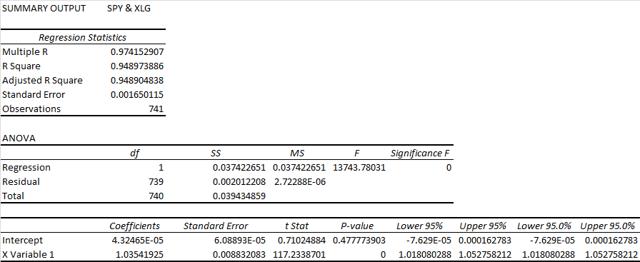
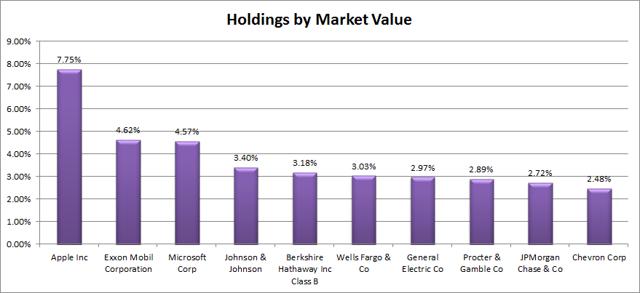 Summary I’m taking a look at XLG as a candidate for inclusion in my ETF portfolio. The expense ratio relative to the diversification is simply poor. The high correlation with other major funds (like SPY) limit the uses for the ETF. I can’t see any way to include XLG in a portfolio on the efficient frontier. I’m not assessing any tax impacts. Investors should check their own situation for tax exposure. Investors should be seeking to improve their risk adjusted returns. I’m a big fan of using ETFs to achieve the risk adjusted returns relative to the portfolios that a normal investor can generate for themselves after trading costs. I’m working on building a new portfolio and I’m going to be analyzing several of the ETFs that I am considering for my personal portfolio. One of the funds that I’m considering is the Guggenheim Russell Top 50® Mega Cap ETF (NYSEARCA: XLG ). I’ll be performing a substantial portion of my analysis along the lines of modern portfolio theory, so my goal is to find ways to minimize costs while achieving diversification to reduce my risk level. What does XLG do? XLG attempts to track the total return of the Russell Top 50® Mega Cap Index. At least 90% of funds are invested in companies that are part of the index. XLG falls under the category of “Large Blend”. Does XLG provide diversification benefits to a portfolio? Each investor may hold a different portfolio, but I use (NYSEARCA: SPY ) as the basis for my analysis. I believe SPY, or another large cap U.S. fund with similar properties, represents the reasonable first step for many investors designing an ETF portfolio. Therefore, I start my diversification analysis by seeing how it works with SPY. I start with an ANOVA table: (click to enlarge) The correlation is almost 97.5%. That high correlation will limit the potential for benefits through diversification and puts XLG in a difficult situation where it may have to be considered as an alternative to SPY rather than as a complimentary holding. Standard deviation of daily returns (dividend adjusted, measured since January 2012) The standard deviation is excellent. For XLG it is .6868%. For SPY, it is 0.7300% for the same period. SPY usually beats other ETFs in this regard, so having a lower standard deviation is excellent. Mixing it with SPY I also run comparisons on the standard deviation of daily returns for the portfolio assuming that the portfolio is combined with the S&P 500. For research, I assume daily rebalancing because it dramatically simplifies the math. With a 50/50 weighting in a portfolio holding only SPY and XLG, the standard deviation of daily returns across the entire portfolio is 0.7038%. If an investor wanted to use XLG as a supplement to their portfolio, the standard deviation across the portfolio with 95% in SPY and 5% in XLG would have been .7270%. Why I use standard deviation of daily returns I don’t believe historical returns have predictive power for future returns, but I do believe historical values for standard deviations of returns relative to other ETFs have some predictive power on future risks and correlations. Yield & Taxes The distribution yield is 1.91%. The yield is almost 2%, which I think is about the minimum yield for a large position in a portfolio if the investor is retiring. It’s close enough to that arbitrary cut off that it could certainly be used, though I don’t find it very attractive for that. I’m not a CPA or CFP, so I’m not assessing any tax impacts. Expense Ratio The ETF is posting .20% for an expense ratio. I want diversification, I want stability, and I don’t want to pay for them. The expense ratio on this fund is higher than I want to pay for an ETF that invests in U.S. equity securities. I understand some ETFs will need higher expense ratios because of their operations, but I have not found any justification for this expense ratio. I’ll touch on this again in the part on holdings. Market to NAV The ETF is at a .11% premium to NAV currently. Premiums or discounts to NAV can change very quickly so investors should check prior to putting in an order. I wouldn’t want to pay a premium greater than .1% when investing in the ETF, though there could be arguments for various accounting issues which may justify the premium. Largest Holdings Consider me unimpressed by the holdings here. It’s not that I don’t like the individual holdings of the ETF, but I want diversification in an ETF. Diversification costs money. If the expense ratio is going to be .20%, I would want substantially better diversification. If an investor has a fairly large pool of money, they could just buy all of the underlying securities and eliminate the expense ratio. If the holding period was long enough, their costs may end up being lower. I’m picking ETFs based on diversification at cheap prices. This is the opposite of that. (click to enlarge) Conclusion I’m currently screening a large volume of ETFs for my own portfolio. The portfolio I’m building is through Schwab, so I’m able to trade XLG with no commissions. I have a strong preference for researching ETFs that are free to trade in my account, so most of my research will be on ETFs that fall under the “ETF OneSource” program. I’m not impressed with XLG. I like the low standard deviation of returns, but the fairly high correlation means I’m not able to diversify away much of the remaining risk. It could be used as a replacement for SPY because of the low standard deviation of returns, but there are other ETFs with lower expense ratios that can be used for those purposes. For instance, I would use (NYSEARCA: SCHD ) or (NYSEARCA: SCHV ) before XLG if I was looking for exposure to huge U.S. Companies with slightly less volatility. If I was willing to pay higher expense ratios than those two funds, I’d look at (NYSEARCA: SPLV ) with an expense ratio of .25% but a significantly lower standard deviation of returns. In my opinion, XLG is suffering from high expense ratios that cause the ETF to be slightly less efficient than competitors. I might come back and analyze XLG further at some point, but with so many great ETFs to choose from I’m not sure I’ll find time to spend one that was weak in my first pass. Additional disclosure: Information in this article represents the opinion of the analyst. All statements are represented as opinions, rather than facts, and should not be construed as advice to buy or sell a security. Ratings of “outperform” and “underperform” reflect the analyst’s estimation of a divergence between the market value for a security and the price that would be appropriate given the potential for risks and returns relative to other securities. The analyst does not know your particular objectives for returns or constraints upon investing. All investors are encouraged to do their own research before making any investment decision. Information is regularly obtained from Yahoo Finance, Google Finance, and SEC Database. If Yahoo, Google, or the SEC database contained faulty or old information it could be incorporated into my analysis. The analyst holds a diversified portfolio including mutual funds or index funds which may include a small long exposure to the stock. Scalper1 News
Scalper1 News