Scalper1 News
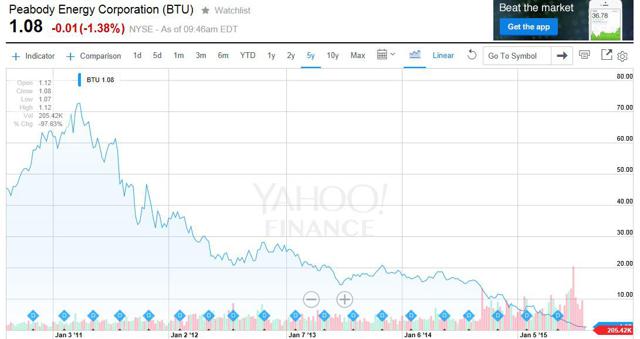
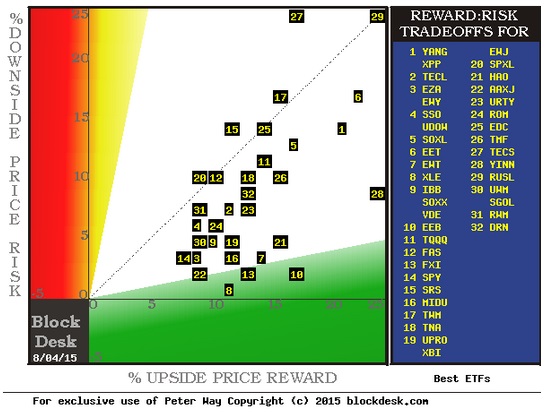
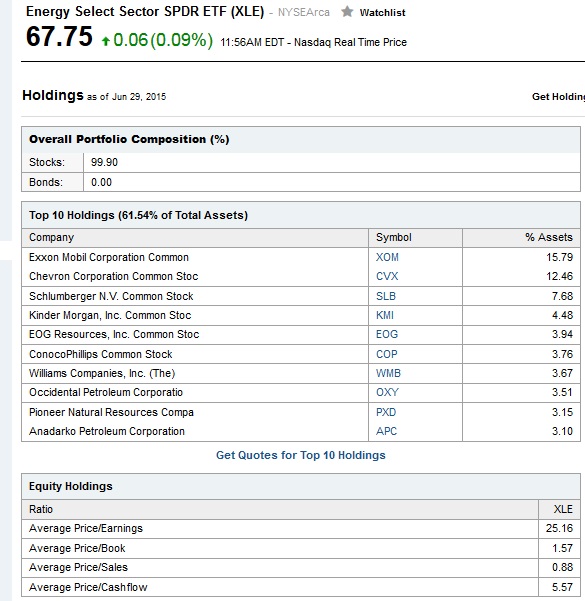
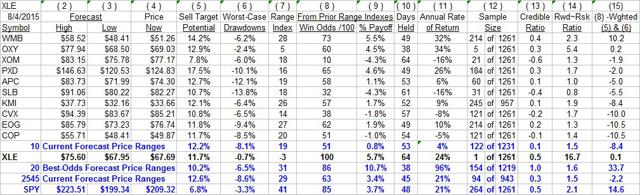 Summary Their prices are all driven by the common denominator of WTI crude prices. Long and Inverse, Leveraged and Unleveraged, all are negatively impacted as crude fights to retain its present share of energy demand. The most telling influence on energy investments, both near term and long term is uncertainty. Near term: Fuel price changes. Longer term: Various fuel shares in energy markets competition. Supply and demand set prices. Surprised? Probably no one is. But is lack of demand the culprit, causing falling prices? Hardly. A revolution in extractive technology has revealed the extent of available, economically attractive natural gas resources, not only in North America, but also worldwide. In comparison to the $4+ prices available in US payoffs up to a year ago for 1 million BTUs of heat generation from reliably available fuel sources, developer-producers in the northeast USA (under financial pressures created in acquiring natural resources) have had to flood the market. The forced surplus over normal demand causes the products to change hands in volume at prices less than half of what used to be. Worse yet, there are reports that major, established NG producers have costs as low as $1.50, and in key areas, sub-$2 prices are the norm. The geology providing this bonanza is not limited to the US. Europe and Asia have identified similar deposits and the extractive technology learning curve is in motion. Coal, which a decade ago was regarded as the USA’s electrical energy backbone, with over 600 years of domestic reserves available, is now facing a virtual complete takeover of its demand market by natural gas. Utilities, prodded by ecological regulations, are converting as fast as they can to get pipeline connections. The stock of Peabody Energy Corporation (NYSE: BTU ), the largest coal supplier, sold above $60 as recently as mid-2011. Now it trades at under $1.20 a share, just 5 years later. (click to enlarge) This is not a transient, irregular, or cyclical phenomenon. It is a major change in the state of energy economics. It is already having major effects in the sources of energy conversion. Before a decade from now passes, it will produce major changes in motive power for personal transportation. It is already impacting commercial hauling. Obama may take credit for a major shift in carbon reductions at electric power plants, but should only get props for being politically agile. Major, established energy producers will have to adapt to the new scene, or become minor players as others in the chain of energy production to consumption become more important. It remains to be seen whether the petroleum industry’s giants, many of whom have been faltering in their efforts to maintain their competitive stature will find a way to utilize the resources at their disposal to acquire new strengths and shuck off major commitments that have high risk quotients for economic disaster. Some, like deep-water offshore development well projects with huge capital commitments cannot dodge return on investment disaster. The major profit source for petroleum producers is gasoline, refined from crude oil, consumed largely in the US by the transportation sector. When crude was priced above $100 a barrel (little more than a year ago) nat gas was quoted at $4.50-$5. Elaborate engineering tests quoted extensively by Wikipedia indicate equivalent miles per gallon operating costs on a wide variety of in-production automobiles to be 2 ½ times as costly for ICE gasoline-consuming vehicles as purely electric-drive vehicles. Annual fuel costs under average operating conditions were shown as $2,300 for popular present-day ICE cars and less than $1,000 for electric models. Since then, crude costs have declined from $100+ to under $50. Gasoline costs have declined less, from $4.50 a gallon to $3.50. Nat gas prices have declined from $5 to $2.30 in major exchanges, but in many areas they are quoted well under $2. To be more specific, with electricity costs declining and electrical utility presence pervasive geographically, fuel economics and environmental concerns will cause widespread auto conversions from internal combustion engines (ICE) with relatively low energy conversion efficiency from high-cost gasoline or diesel fuel to more efficient electrical motor-powered vehicles. Vehicles residentially fueled overnight by electrical power from Utilities using low-cost natural gas economically delivered to their generating stations by pipeline distribution systems from producing areas. Currently average new car purchase prices average $33,000 to $35,000. Most electric car models currently being offered or in development are priced or aimed at less than this, even before governmental promotion discounts of as much as $7,500. The current major inhibition is distance range. Most electric cars are limited to under 100 miles. The attempted marketing quick-fix is hybrid vehicles, basically still an ICE car, but with electric assist, touted as an electric car with an ICE recharging lifeboat when the volts are depleted. As long as a major part of the gullible consuming public will lease the hybrids or long term finance them, the conversion will be slow. But progress in battery development and increasing awareness of the reduced per-mile transportation cost of the bulk of everyday driving will hit the accelerator at some point. Then, fashion will move from the back seat into the driver’s position. At that point, the ICE and gasoline demand are threatened. Could Chevron (NYSE: CVX ) and Exxon Mobil (NYSE: XOM ) become a BTU? Why aren’t energy stocks ready to recover? Big-money investment funds are nibbling at diversified energy ETFs. That is evident in the risk/reward tradeoff signaled by Market-Maker (MM) hedging of volume (block) trades, often involving $1 million or more at a time. Present day markets can’t handle such trades “regular-way” (by automation or high-frequency trading algorithms) so the Market-Makers are called on to provide liquidity. That only happens where they can find a speculator to take on the risk, usually via a hedging deal, done thousands of times a day. Such hedging reveals just how far knowledgeable investors think the involved securities prices might go, both up and down. Figure 1 shows how major Exchange Traded Funds (ETFs) are currently being viewed by players in the game who have the money muscle to move prices. Figure 1 (Used with permission) In this map of upside to downside prospects, lower-right (green) is good, upper-left (red) is bad, and the dotted diagonal is where they balance. Location [8] is the Energy Select Sector SPDR ETF (NYSEARCA: XLE ). Its minimal downside and passable upside suggest prospects for a favorable tradeoff. To check that out, let’s see how the same crowd views each of XLE’s largest holdings. Figure 2 (Source: Yahoo Finance) XLE’s roundup of ten of the usual suspects brings in over 60% of its committed capital. When we put them to the test of what the market-making professionals think their big-$ portfolio-manager clients are likely to do next, Figure 3 tells an interesting story. Figure 3 (click to enlarge) Hedging actions by MMs in block trades on each of the major holdings of XLE and in XLE itself imply the prospective price ranges in columns (2) and (3). (5) is the upside of (2) above (4). (6) tells the typical actual stresses experienced in 3-month holdings following forecasts like today’s, encountered the sample number of times (12) in the past 5 years. (9) shows what the net gains of those experiences were, and (8) tells what proportion of them recovered from the traumas of (6) to bring home a profit. Now, let’s look at these quantities for the average of the ten largest XLE holdings, and compare those averages to what is expected of XLE. The (5) upside is supported, but there seems to be some anti-gravity legerdemain at work on the downside. Maybe it is because the small sample of 1 in (12) for XLE may not be as convincing as the average of 122 experiences for each of the ten holdings. Also, disturbing is the fact that barely half of the holdings were able to dig themselves out of the drawdowns back into a profit (9). Not a very magnificent profit at that, less than 1%, particularly when compared to the +10%+ earned by the 20 currently top-ranked equities in our daily list. There about 7 of every 8 positions was a winner. The implied upside recovery potential of the holdings lacks credibility (13) where (9) actual history of 0.8% is compared to (5) implied profit prospects of +12.2%. Is this all just fantasy, numbers sucked out of the thumb of some analyst? When things don’t fit together well, such concerns may be justified. We need to have some reassurance that this is not some ENRON or LIBOR situation. Figures don’t lie, but … we all know what has happened. I can tell you that there is evidence in the form of double-entry recorded actual exchange transactions in the hedging deals that can’t be faked. In addition, real money has been endangered to transfer risk from one party to another, and the trade initiator in each case has wanted badly enough to get his order filled to say that the cost of the price insurance required is not excessive enough to prevent him from paying it. Consenting adults from 3 directions form a financial menage-a-trois. Real life in the investment world often means someone is wrong and gets … disappointed. Conclusion There is enough rational discontinuity here to encourage serious thinkers to look elsewhere for profitable pursuits. Disclosure: I/we have no positions in any stocks mentioned, and no plans to initiate any positions within the next 72 hours. (More…) I wrote this article myself, and it expresses my own opinions. I am not receiving compensation for it (other than from Seeking Alpha). I have no business relationship with any company whose stock is mentioned in this article. Scalper1 News
Scalper1 News