Scalper1 News
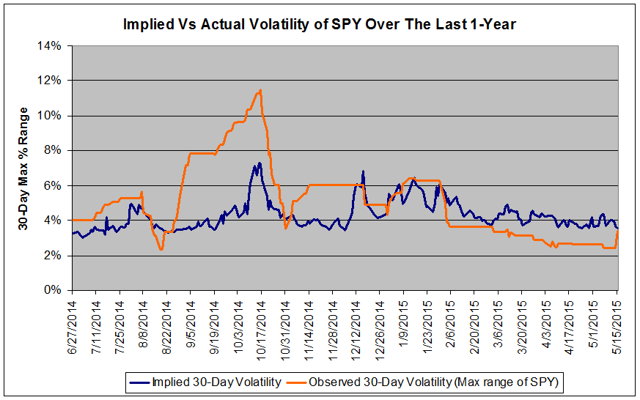
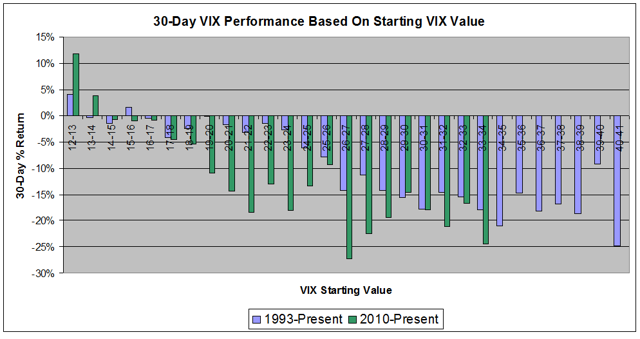
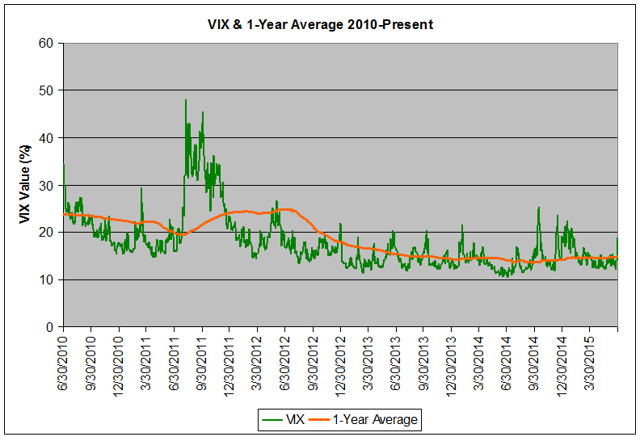
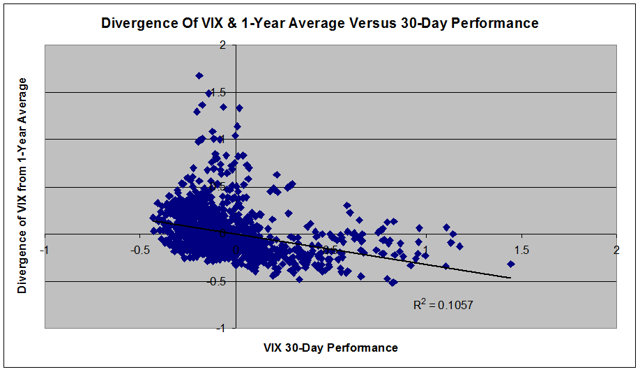
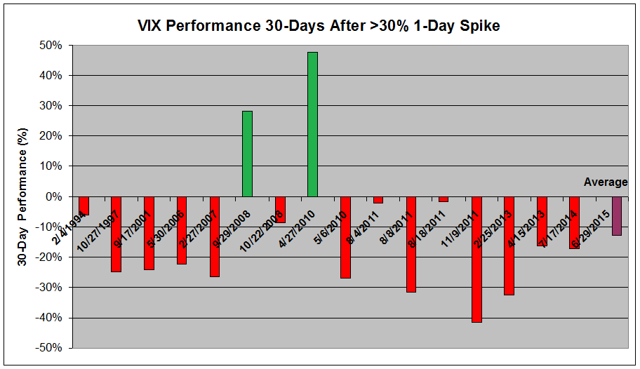
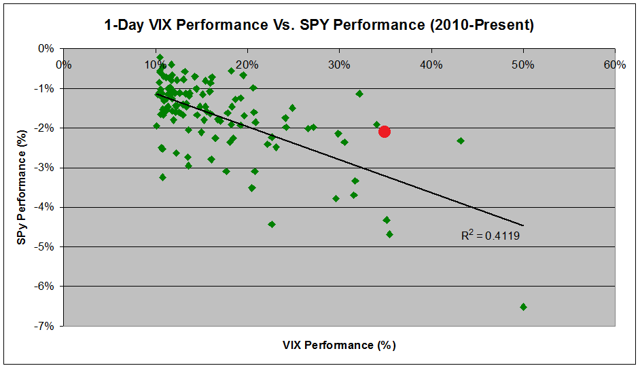
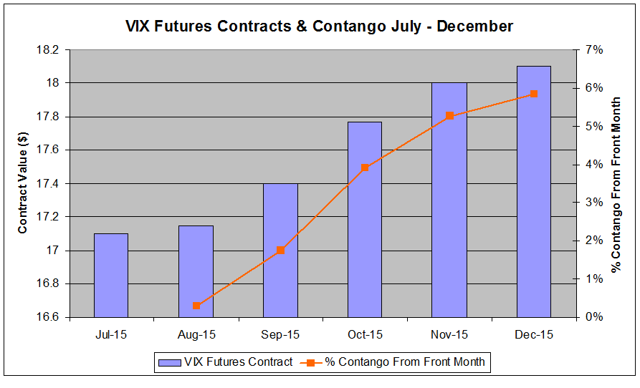
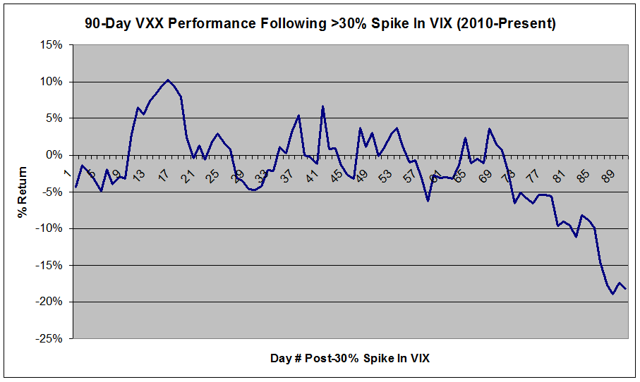
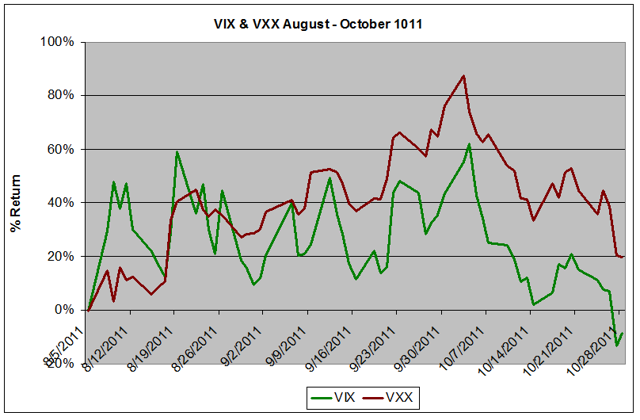 The VIX surged 35% on Monday, its largest jump in over 2 years, as US markets shed 2% amidst worries that Greece will leave the Eurozone. This article analyzes Monday’s VIX spike in the context of previous volatility spikes and discusses the advantages, disadvantages, and risk/reward profile of a volatility short position. A short volatility position will earn most of its profits from mean reversion with minimal contango-generated rollover profits, but historically carries a reduced risk for further volatility surges. My positions and trading strategy along with entry and exit criteria are discussed in detail. As Greece teetered on the brink of default and ejection from the Eurozone, volatility surged on Monday, rattling US markets out of the summer doldrums. The Dow Jones fell 350 points or 1.9%, the largest one-day drop in 2 years, leaving the index in negative territory for 2015. The S&P 500 also took it on the chin, slumping 2.1%, and at 2,058 is at its lowest point since April 2. As a result, the CBOE S&P 500 Volatility Index (VIX) surged 34.5% to 18.85, the largest one-day spike since April 2013 and highest close since February 2, 2015. Unsurprisingly, there was fear aplenty on Wall Street on Monday. However, as the saying goes “buy when there is blood in the streets” – or in this case, sell. Due to its tendency towards mean reversion, sudden spikes in the VIX often represent opportune times to bet on the VIX correcting lower. This article discusses the mechanics behind the VIX and analyzes historical surges in volatility to assess the risk & reward of betting against the VIX following Monday’s big move. Before going further, it is necessary to discuss what exactly the “VIX” is. When referenced by journalists and even some investors, there is often confusion regarding its units with some authors putting a “$” and others leaving it as a unit-less number. Rarely, however, is the correct punctuation used – a “%” sign. The VIX is actually a percentage. It implies a 66% chance of the S&P 500 moving the percent value of the VIX over 12 months. This can be converted to 30-day implied volatility by dividing by the square-root of 12. So, based on Monday’s VIX close of 18.85, the S&P 500 has a 66% chance of moving up or down 5.44% over the next 30 days. Thus, the market expects that there is a one-in-three chance that the S&P 500 will close below 1,946 or above 2169 30-days from now, versus Monday’s closing price of 2058. How has VIX implied probability fared over the last year? Quite poorly, actually. Even with Monday’s abrupt drop, the S&P 500, as measured by the SPDR S&P 500 ETF (NYSEARCA: SPY ), has gone 73 days without the VIX’s implied volatility verifying. On May 15 – 30 trading days ago – the VIX was at 12.38 which implied a 30-day move of 3.6% in the S&P 500. As of Monday, we had only seen a 3.4% move. This 73-day streak is the longest since SPY began trading in 1993. Figure 1 below plots implied versus observed volatility over the past year. (click to enlarge) Figure 1: Implied vs. Actual volatility showing that since January, observed volatility has trailed implied volatility [Source: Chart is my own, data from Yahoo Finance] Not that observed movement in SPY exceeded that predicted by the VIX during last Fall’s market turbulence, but since the New Year, it has largely underperformed implied volatility leading to a steady decline. The point is, recent observed volatility has underperformed predicted volatility over an extended period. One of the aspects of the VIX that make it unique as an index is that fear is cyclical. Fear and uncertainty don’t last forever and neither does complacency. Inevitably, uncertainty relaxes – either Greece leaves the Euro or it doesn’t – and volatility pulls back to some mean value. Likewise, when markets become too complacent, inevitably some event – such as the Grexit – occurs resulting in volatility rebounding. In other words, when the VIX climbs too high, it corrects downward, and when it falls too low, it rebounds. Figure 2 below shows median VIX 30-day performance based on initial value for the periods 1993-2015 and 2010-2015. (click to enlarge) Figure 2: 30-day VIX performance based on starting value showing strong tendency to mean revert once the VIX reaches 17-18 over the last 5 years, and 24 since 1993. [Source: Chart is my own, data from Yahoo Finance] Note that at very low VIX levels – such as 12-13 or 13-14 – the VIX has a tendency to climb over the next 30 days, while at higher levels, it tends to decline. The point at which the VIX begins to decline is dependent upon our period of record. During the entire period of record – 1993 to present – the VIX didn’t show significant 30-day declines until it reached about 24. Over the last 5 years, however, it showed significant reversion as low as 17. Based on Monday’s close of 18.85, this simple model would predict a 2% decline over 30 days using 1993-2015 data, but a 6% decline using 2010-to-present data. Let’s examine this more closely. As shown above, mean reversion plays a large role in the VIX. However, this “mean” value can fluctuate depending on the overall market. Figure 3 below shows the VIX over the past six years along with its 1-year average value. (click to enlarge) Figure 3: VIX versus 1-year average since the latest bull market began in 2010. Note that Monday’s VIX is 28% above the 1-year average of 14.75. [Source: Chart is my own, data from Yahoo Finance] During and following the last European Crisis in 2011, the 1-year average VIX value reached as high as 24.50. Since that time, however, the average VIX has declined and was 14.75 as of Monday’s close. Thus, the VIX at 18.85 is 28% above its 1-year average value – but would have been below the 1-year mean back in 2011. Figure 4 below shows a scatterplot of the resulting 30-day performance of the VIX based on initial divergence in the VIX from 1-year average since 2010. (click to enlarge) Figure 4: 30-day performance of VIX based on initial divergence above 1-year average. As the divergence from the 1-year average increases, the VIX tends to decline. [Source: Chart is my own, data from Yahoo Finance] Admittedly, this isn’t the highest quality data set, but it does suggest an element of mean reversion. Using these numbers, the VIX at 28% above its 1-year average would be expected to decline 8.9% over the next 30 days. Let’s narrow our focus and look at VIX performance following large single-day spikes in volatility such as the one we saw on Monday. Since 1993, there have been 16 daily spikes in the VIX greater than 30%. Figure 5 below shows the performance of the VIX following these spikes, sorted by year. (click to enlarge) Figure 5: Implied Vs. Actual volatility showing that since January, observed volatility has trailed implied volatility [Source: Chart is my own, data from Yahoo Finance] Of these 16 occasions, the VIX has declined over the next 30 days in 14 out of 16 episodes, or 88% of the time with a median decline of 19.8%. Further, since the Flash-Crash in May of 2010 triggered a nearly 50% rally in the VIX subsequent to an April 2010 VIX spike, the VIX has fallen following a 30% one-day rally such as Monday’s the last 8 consecutive times with a median loss of 22%. Before discussing how best to invest using this data, I would like to present one final piece of data. Figure 6 below plots every > 10% one-day move in the VIX against the performance of SPY on that day since 2010 (115 occurrences). The red dot shows Monday’s VIX/SPY performance. (click to enlarge) Figure 6: VIX vs. SPY daily performance since 2010 showing that as SPY declines, the VIX tends to rally. However, Monday’s 35% rally in the VIX was much larger than predicted based on the SPY’s 2.1% decline. [Source: Chart is my own, data from Yahoo Finance] Granted, there is not a strictly linear relationship between the two, but, generally, as the magnitude of the loss in SPY increases, so does the jump in the VIX. However, note that the red dot representing Monday lies well above the trendline. This suggests that, based on the last 5 years of data, Monday’s jump in volatility was out of proportion to the decline in SPY. In fact, based on the dataset, a 2.1% decline in SPY would correlate with only a 19% jump in the VIX, nearly half of what verified. There are two possible explanations. First, due to recent tranquil conditions, the VIX was very low last week, below its one-year average of 14.75, at 14.02 as of Friday’s close, meaning that it had a lot of “catching up” to do to reach “market crisis” levels. Second, a nation leaving the Eurozone has never happened before, injecting substantial uncertainty into the mix, especially given the relatively small size of Greek’s economy. Nobody knows what the impact of a nation leaving the Eurozone will have on the other member nations with larger economies, and their trading relationship with the United States. In summary, the VIX shows a strong tendency to mean revert following spikes in volatility. This was evaluated based on the magnitude of VIX value, the divergence from a 1-year mean value, and following large one-day spikes, all of which showed a strong tendency towards mean reversion once values reached Monday’s close of 18.85. Further, Monday’s domestic market declines weren’t all that impressive given the 35% rally in the VIX suggesting that volatility may have gotten away from itself a little bit. If you believe that this is the beginning of a broad market collapse, further spikes in volatility may be to come. However, if you believe that the US will weather the fallout from Europe and markets will settle down as it has following similar spikes over the last few years, betting on a declining VIX following Monday’s surge is a high-probability play. What is the best way to get short the VIX? Unfortunately, there is no direct way to invest, long or short in the spot VIX. The AccuShares Spot CBOE VIX Up (NASDAQ: VXUP ) and Down (NASDAQ: VXDN ) shares were released last month with an objective to track the spot VIX (and inverse spot VIX for VXDN). Unfortunately, as I discussed in my Article Last Week , these ETFs have woefully underperformed. VXUP and VXDN gained 8.0% and lost 7.78% Monday, respectively. The best option is VIX Futures-based ETFs. Investors shorting these products benefit not only from mean reversion, but also from contango-mediated rollover loses. When volatility is low, contango tends to be high, meaning that investors short at that time are likely to benefit from large rollover losses, but will be at risk from sudden surges in volatility, such as what was seen on Monday. Unfortunately, following volatility spikes, contango tends to diminish. Figure 7 below shows VIX futures contracts for the next 4 months. (click to enlarge) Figure 7: VIX futures contracts for July 2015 through December 2015 showing that Monday’s spike in volatility effectively erased the long-standing contango that had dominated to futures market. [Source: Chart is my own, data from Yahoo Finance] The current front-month contango is a negligible 0.3%, down from 6.5% on Friday. Subsequent months are not that much better with total rollover losses over the next 5 months under 6%. As a result, the majority of near-term profits from a short volatility position will be from mean reversion until the VIX declines to a point where contango becomes an issue again. Fortunately, as discussed above, there is a very high probability of mean reversion going forwards. The most popular volatility ETF is the iPath S&P 500 VIX Short-Term Futures ETF (NYSEARCA: VXX ), which holds front-month and T+1 contracts. The ETF gained 17.1% Monday to $20.31 and is now trading at its highest level since early May. Let’s apply the same historical analysis as Figure 5 above, showing the 30-day performance of VXX following > 30% volatility spikes. Figure 8 below shows the median 90-day performance of VXX for 9 events that have occurred since VXX began trading. (click to enlarge) Figure 8: 90-day median performance of VXX following 9 > 30% VIX spikes since 2010. Note a maximum drawdown of 10% for a VXX short position and a 20% profit after 90 days. [Source: Chart is my own, data from Yahoo Finance] Over 90 days, VXX returned a median 18.1%. Note that the return is slower and choppier than the VIX returns seen in Figure 5, but that the trade is ultimately a winning one, despite the fact that 3 of the VIX spikes occurred in 2011, a period of historically elevated volatility during the last European Crisis. To be clear, the objective of this article is to show that Monday’s VIX spike represents an ideal entry point for a volatility short position, not a risk free-one. To evaluate potential losses, let’s imagine that a Greece exit from the Eurozone triggers a repeat of the 2011 European Crisis. After bottoming at 12.5 on 6/23, the VIX has since surged 51% as of Monday’s close. In 2011, the VIX bottomed at 15.3 on July 7, but took nearly 2 months to rally 50%, reaching that point on August 5, 2011. We will use that as a starting point and plot returns of VIX and VXX from there until volatility peaked to evaluate potential losses for a VXX short position initiated on Monday. This data is shown below in Figure 9. (click to enlarge) Figure 9: Summer 2011 returns for VIX and VXX after initial 50% VIX spike – i.e. our current situation – showing maximum 85% VXX drawdown before mean reversion. [Source: Chart is my own, data from Yahoo Finance] As the data shows, should the current crisis blow up to 2011 proportions, VXX short positions have potential to lose in excess of 80% before volatility mean reverts. Ultimately, the trade would be a winning one, but investors would have had to endure large paper losses prior to that point. Note that, in a somewhat unusual occurrence, VXX actually outperformed the VIX, which was likely due to a contribution from backwardation, as rollover losses became rollover profits for a short period of time. For those, anxious about shorting a volatility product into a dangerous market, an alternative investment would be a long position in the VelocityShares Daily Inverse ETF (NASDAQ: XIV ) which declines as the VIX increases, meaning that losses shrink as the VIX increases and are limited to 100% if the product goes to zero. I prefer short VXX to long XIV because, while both mean revert and capitalize on contango, XIV underperforms over the long term as I discussed in This Article due to the process of creating the inverse ETF. For investors looking for a lower volatility ETF than VXX, a short position in the iPath S&P 500 Medium-Term Futures ETF (NYSEARCA: VXZ ) or a long position in the VelocityShares Daily Inverse Medium-Term ETF (NASDAQ: ZIV ), which hold less volatile T+3-T+6 contracts may be more appropriate. Despite the added advantage of leverage-induced decay, I would recommend avoiding the leveraged VelocityShares Daily 2x VIX Short-Term ETF (NASDAQ: TVIX ) due to the potential for > 100% losses should volatility continue to spike before mean reverting. When the VIX eclipsed 18 Monday afternoon, I initiated a small short position in VXX at an average price of $20.25 worth 5% of my portfolio. I believe that this is not a time for bulk purchases and plan to slowly increase my position should the VIX continue to spike. I will add small positions at 10-15% VIX intervals until the position reaches 12% of my portfolio. Should the Greek crisis devolve into a continent-wide crisis that threatens to lead to a long-term increase in volatility, I will plan to exit the position and cut my losses. In conclusion, I believe that Monday’s VIX spike represents an ideal entry point due to the historical high-probability for mean reversion. I recognize that relying on history is not always a sound strategy and will therefore closely monitor market sentiment and will be prepared to cut my losses if need be. That being said, I expect volatility will revert to its recent historical average of 14-15 and will plan to hold my VXX short position to initially capitalize on mean reversion and subsequently rollover-mediated losses. Disclosure: I am/we are short VXX. (More…) I wrote this article myself, and it expresses my own opinions. I am not receiving compensation for it (other than from Seeking Alpha). I have no business relationship with any company whose stock is mentioned in this article. Scalper1 News
Scalper1 News