Scalper1 News
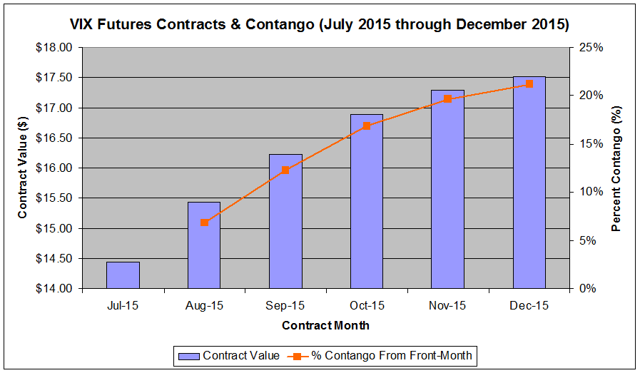
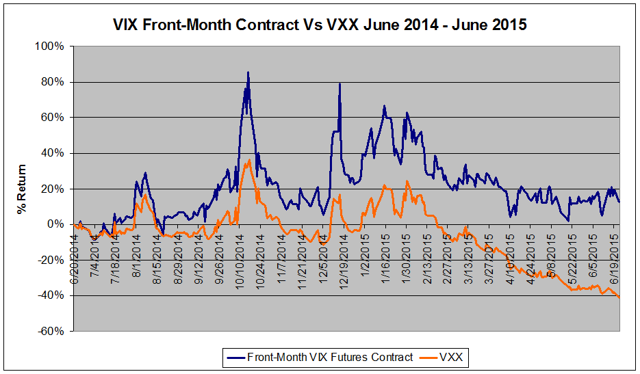
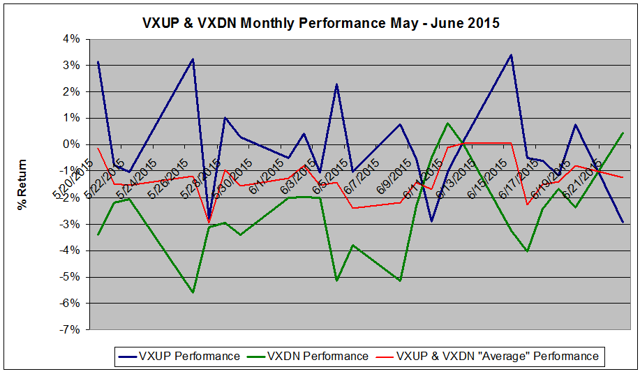
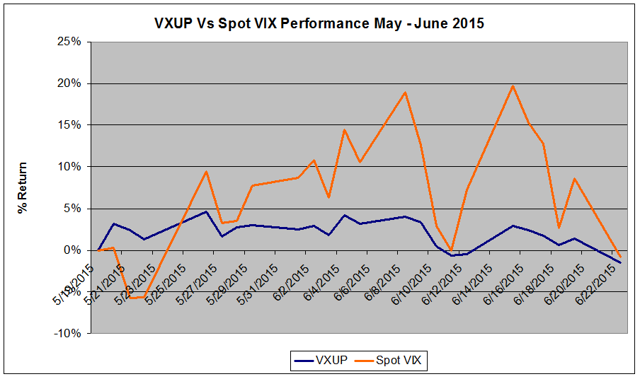
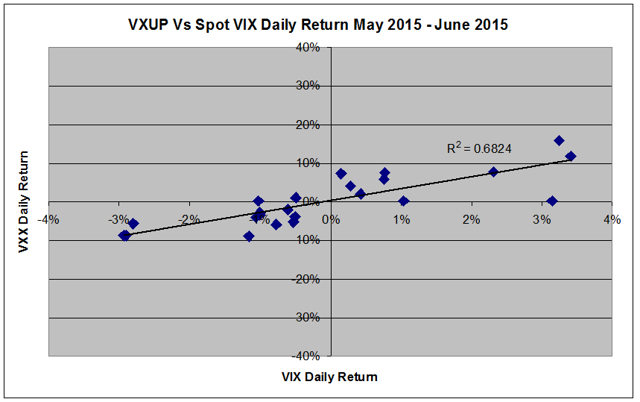
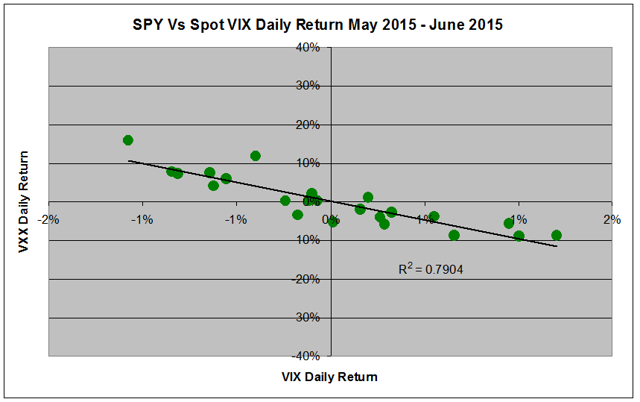 On May 19, AccuShares rolled out two new volatility ETFs–VXUP and VXDN–that were advertised to track the spot VIX without suffering the losses that plague conventional volatility ETFs like VXX. It has now been 1 month since these funds started trading and while VXUP and VXDN have achieved a portion of their objective, they have failed spectacularly in another. This article discusses the mechanics of VXUP and VXDN, compares their performance over the past month to the spot VIX and VXX, and offers alternative investment ideas. Investing in the VIX has long been a challenge for investors. Because direct investment is not possible for the average trader, an assortment of ETFs have been created to facilitate the process. The most popular of these is the iPath S&P 500 VIX Short Term Futures ETF (NYSEARCA: VXX ), although many others, including inverse and leveraged products, are also available. Unfortunately, these ETFs are all based on VIX futures contracts and inevitably underperform the VIX over the long-term, making them exceptionally difficult investments. I was therefore very excited to learn that a new pair of VIX ETFs would be entering the marketplace in mid-May that were designed to track the spot price of the VIX and to avoid futures contracts. One, the AccuShares Spot CBOE VIX UP Shares (NASDAQ: VXUP ) was designed to directly track the spot VIX while the other, the AccuShares Spot CBOE VIX DOWN Shares (NASDAQ: VXDN ) would trade inversely to the spot VIX. Could these be what volatility ETF investors have long been waiting for? It has now been one month since these new products began trading. This article analyzes the performances of VXUP and VXDN in their first month of trading and compares them to the spot VIX and VXX. VIX ETFs that use futures contracts to track the VIX are limited by the fact that VIX futures contracts expire after one month. As a result, these funds must sell their contracts by the end of each month and rotate them into the next month’s futures contract. They typically do this on a daily basis, rotating between 4% and 5% each day to rotate the entire equity of the fund in each 20- or 25-day month. Unfortunately, the VIX futures market usually trades in a steep contango, a situation where subsequent contracts are more expensive than current contracts. Figure 1 below shows the current VIX futures contracts for the next six months as of Monday’s close showing this contango. (click to enlarge) Figure 1: VIX Futures Contracts for July through December as of Monday’s close showing persistent contango with the August contrast nearly 7% more expensive than the August contract. [Source: YahooFinance ] The August 2015 futures contract is trading at a 6.8% premium to the current front month July 2015 contract. As a result, VXX is currently selling July 2015 contracts and using the funds to buy August 2015 contracts. As of Monday evening, the fund holds 82% July contracts and 18% August contracts. Over the coming weeks it will rotate 4% of its funds per day from July into August contracts. As a result, the fund is effectively selling low and buying high. Should the contango hover around 7%, the fund will suffer a daily loss of 0.04 * 0.07, or 0.28%. This is a small loss for those trading these funds on a short-term basis, but over time it adds up. Figure 2 plots VXX versus the front-month VIX contract it is designed to track over the last 1 year. (click to enlarge) Figure 2: VXX versus VIX over the past 1 year showing steep underperformance of VXX due to rollover losses. [Source: YahooFinance ] As the data above shows, VXX massively underperforms the front-month VIX futures contract, losing 41% over the last year while the VIX gained 13%. With 260 trading days, the 28% underperformance amounts to a 1-year average of 0.11% per day. This is a significant amount of drag for an investor long VXX waiting for a volatility spike. The natural gut reaction to this data would be to just short the ETF and kick back and let the profits roll in. However, this is also an inherently risky strategy. While VXX may underperform over the long-term, it can spike dramatically during market swoons. For example, during the summer of 2011 during the European Crisis, VXX jumped from $331 on July 22 to $909 on October 3, a short-breaking 174% gain. With the VIX trading at 12.74 as of Monday’s close well below its long-term average of 19 and with Greece teetering on the edge of another crisis, I would be reluctant to be short here. Due to this challenging set of trading conditions for ETFs such as VXX, investors have long clamored for an alternative ETF that did not have the limitations of futures-based VIX ETFs. Enter AccuShares. On May 19, the company released VXUP and VXDN for trading. Unlike VXX and its ilk for which the underlying index is the front month VIX Futures contracts, the underlying index for these two ETFs is the CBOE Volatility Index itself, the VIX. This should, in theory, prevent rollover losses. The management of the two is very complex. Briefly, VXUP and VXN operate as a pair and swap assets back and forth as the VIX fluctuates. Neither fund holds futures contracts, but just cash and cash equivalents such as treasuries. Each of the funds operates around a “Distribution Period” on the 15th of each month, at which point the value of the fund that gained the previous month is adjusted with payout of a cash dividend reducing its value to that of the declining fund. For example, let’s say that VXUP and VXDN each start the month out at $20/share and the VIX starts at 15. The VIX rallies 20% to 18. VXUP would be predicted to rise to $24 and VXDN would be predicted to decline to $16. At the end of this month, holders of VXUP would receive a $8 dividend in either cash or in an equal value of VXDN and the value of VXUP would be adjusted to $16, and both funds would start the next monthlong period at the same price. Finally, if the VIX is less than 30 (which it almost always is), 0.15% is transferred from VXUP to VXDN on a daily basis to provide an incentive to invest in the inverse ETF. The reasoning is that the VIX will eventually spike and investors are therefore less likely to want to buy-and-hold VXDN. At least, that is how everything is supposed to work in theory. However, this is not a discussion on the complex mechanics of these funds, but rather an analysis of their performance. Between May 19 and June 22, the VIX was remarkably flat, declining just 0.9% over the monthlong period. During the same period, VXUP declined 1.5%, a small 0.6% underperformance. VXDN gained 0.4%, a 0.5% underperformance. In contrast, VXX declined 8.8%, a much larger 7.9% underperformance. Further, VXUP and VXDN did not seen the same decay that plagues VXX and similar funds. Figure 3 below compares the monthly performance of VXUP and VXDN along with an “average” percent return between the two. If there was inherent decay and underperformance, the “average” return would be expected to steadily decline. For example, VXUP and VXDN might initially be up or down 4%, respectively, but by the end of the month would be up 8% and down 12%, respectively, for an “average” of -2%, indicating decay. (click to enlarge) Figure 3: VXUP and VXDN performance over the past month along with an average of the two showing minimal decay of the funds that would be expected of a fund based on Futures contracts such as VXX. [Source: YahooFinance ] Based on Figure 3, VXUP and VXDN trade in nearly perfect opposition over the course of the month with the average percent return between the two flat near zero indicating minimal decay. Based on these performance numbers alone, these two new ETFs look promising. However, this does not paint the entire picture. Figure 4 below plots the percent change in VXUP versus VIX over the past month. (click to enlarge) Figure 4: VXUP versus VIX over the past month showing the large volatility shortfall of VXUP compared to its underlying index. [Source: YahooFinance ] The data above shows that VXUP significantly underperformed VIX during periods of increased volatility. For example, on June 8, the VIX spiked 7.6%, but VXUP was only able to manage a 0.8% gain, barely 1/10th of the VIX’s performance. On June 15th, the VIX rallied 11.7% with VXUP gaining 3.4%, better but still an awful underperformance. Thus, the fact that VIX and VXUP both finished the month with nearly equal 1% declines is merely a function of the VIX trading flat and is unrelated to effective tracking by VXUP. To illustrate, if instead of a month range, we use the period of May 21 to June 15, the VIX gained 27% while VXUP only climbed 0.6%. In the fund’s defense, between June 15th and June 22, the VIX fell 17% while VXUP only dropped 4%. Thus, VXUP is not necessarily underperforming the VIX, it simply appears to be less volatile than the VIX. Unfortunately, volatility is what makes the VIX ETFs so popular. To analyze VXUP’s performance further, Figure 5 below shows a scatterplot of VXUP daily performance vs VIX daily performance. (click to enlarge) Figure 5: Daily performance of VIX versus VXUP over the past month showing diminished volatility of VXUP as well as mediocre tracking compared to its underlying index. [Source: YahooFinance ] This data highlights two important points, neither of which is favorable for VXUP. First, note the shallow slope of the trend line in the figure. This approximates the beta of VXUP relative to the VIX. Beta is traditionally thought of as a measure of the volatility of a security or portfolio in comparison to the market as a whole. A stock with a beta of 1 indicates that a stock’s price movement will mimic that of the market – if the S&P 500 gains 5%, the stock will gain 5%; if the market is flat, the stock will be flat; and if the market falls 5%, the stock will fall 5%. A stock with a beta of 2 is more volatile than the market – a tech stock, for example – and will gain or lose twice that of the S&P 500 or whatever index is used as the benchmark. A beta of 0.5 is comparatively less volatile – a utilities stock, for example – and will gain or lose half of the market’s performance. Betas can also be calculated for one stock or ETF versus another stock or ETF. Let’s calculate the beta for VXUP relative to VIX. If the Beta is 1, this means that VXUP sees daily gains and losses comparable to that of the VIX. We already know what the result is going to be. Unfortunately, the beta for VXUP over the past month has been 0.21, meaning that the fund is only about 1/5th as volatile as the index it is trying to track. In other words, its creators successfully sought to eliminate decay and underperformance, but eliminated all-important volatility and opportunity for outsized gains that makes VIX products so popular investors. Second, Figure 5 also shows that VIX and VXUP don’t really correlate all that well as there is significant scattering around the trend line. The R^2 for the relationship is a lackluster 0.68 indicating a poor day-to-day tracking. In fact, VXUP isn’t all that much better than an ordinary Index ETF, both in terms of approximating the volatility of the VIX and effectively tracking its day-to-day movement. Let’s perform the same calculation as in Figure 5 using the SPDR S&P 500 ETF Trust (NYSEARCA: SPY ), the oldest and most popular index ETF, instead of VXUP. A scatterplot comparing daily movement of VIX versus SPY is shown below in Figure 6. (click to enlarge) Figure 6: Daily performance of VIX versus SPY over the past month showing comparable volatility of SPY and VXUP (shown in Figure 5). [Source: YahooFinance ] Note that SPY actually tracks the VIX more accurately on a daily basis than VXUP with an R^2 value of 0.79 vs 0.68 for VXUP, although of course the relationship between the two is inverse in that SPY goes down when the VIX goes up. The beta for SPY to the VIX is -0.08 compared to 0.21 for VXUP indicating similar levels of volatility. If one wanted to approximate VXUP’s volatility even more closely using an index ETF, a trader could go long the inverse leveraged Direxion Daily S&P 500 Bear 3x ETF (NYSEARCA: SPXS ) which has a beta of 0.23 and an R^2 of 0.80 relative to the VIX, beating VXUP on both fronts. What conclusions can be drawn from this data? On the one hand, VXUP and VXDN have, after 1 month, avoided the decay from rollover losses that plague Futures-based VIX ETFs like VXX. However, the ETFs have come up woefully short in tracking the day-to-day performance of the spot VIX and matching its volatility, which is what they were advertised to do. In fact, if a trader wants to be free of the rollover-induced decay seen in VXX and approximate the level of volatility seen in VXUP over the past month, he or she is better of shorting a simple index fund such as SPY or buying an inverse index ETF such as SPXS as these have better daily tracking than VXUP and comparable levels of volatility. To be compared to an index fund–intended to be a stable, non-volatile long-term investment for those actively trying to AVOID volatility seen in individual stocks–is a giant slap in the face for a volatility ETF. To put it more succinctly: I want volatility with my volatility ETF! Yes, the funds outperformed VXX, although this could be said of most index ETFs last month. Were the VIX to have spiked, VXX would have likely outperformed VXUP by a considerable margin. While I would like to give these funds the benefit of the doubt that perhaps they will more accurately track the VIX should it start trending directionally rather than the chop that we saw last month, I consider them to be failed funds right now. It is one thing for a fund like VXX to underperform its underlying commodity. Traders know why it does so and accept that underperformance as the cost of the opportunity for volatility exposure. VXUP/VXDN, on the other hand, are more than five-fold less volatile than expected, and it is not clear why. AccuShares had announced plans for similar paired funds for oil, natural gas, metals, and agricultural commodities, but I expect these ETFs will be tabled for now. Where does this leave us? To be honest, I believe trying to get long the VXX is a fool’s errand. Too much comes down to timing. VXX may track the VIX much better than VXUP–it has a beta of 0.41 with an R^2 of 0.89 relative to VIX–but it is suffers the rollover-induced drag discussed above. While the VIX will inevitably spike, waiting for it to do so long VXX can be very costly and not only holds your funds captive, but the eventual volatility spike might not even be enough to overcome rollover losses. The only situation in which I would consider going long VXX would be if the VIX were less than 12, more than 2 standard deviations below its long-term average. Over the last 25 years, when the VIX is less than 12, it rallies an average of 13% over the following month, rising 79% of the time, a high probability jump with a large enough magnitude that would likely outweigh any rollover-induced losses. With the VIX closing at 12.74 on Monday, we may actually be approaching this level. At the same time, I would be very reluctant to short VXX at these levels, even with a 6% monthly drag due to contango given the increased probability of a volatility spike. I prefer the higher probability play and would only consider shorting VXX if the VIX climbed above 20, which would limit further upside risk and allow profits both from rollover losses and any mean-reversion that takes place as volatility subsides. In the meantime, I believe that there are much better investments out there that do not come with the same risks as VXX or the limitations of VXUP. In conclusion, VXUP and VXDN were an admirable attempt by AccuShares to create a novel volatility product that was not dependent on VIX futures contracts and the disadvantages that come with these contracts. However, to date, it has failed to even come close to meeting its objective of tracking the spot VIX on a daily basis. The volatility of VXUP to date is so underwhelming that an investor would just as well use index funds to achieve the same level of volatility exposure. Therefore, I plan to avoid these ETFs barring a significant improvement in daily volatility. That being said, I am not enamored with the alternatives either. While VXX is roughly twice as volatile as VXUP, it’s rollover-induce losses drain a portfolio while waiting for a spike in voltility. Put another way, VXUP and VXDN remove some of the risk of volatility ETFs but take away most of the reward. VXX has more potential for reward, but introduces extra risk in the form of rollover losses. I would only recommend going long VXX when the VIX is at historical lows. Likewise, I would only take advantage of the rollover-induced losses and short the VXX when the VIX is elevated above its baseline average to reduce the risk of a spike in volatility that would devastate a short position. In the meantime, there are over 4000 actively traded stocks in the NYSE and Nasdaq. There are at least a couple that are better bets than trying to force the issue with volatility right now. Disclosure: I/we have no positions in any stocks mentioned, and no plans to initiate any positions within the next 72 hours. (More…) I wrote this article myself, and it expresses my own opinions. I am not receiving compensation for it (other than from Seeking Alpha). I have no business relationship with any company whose stock is mentioned in this article. Scalper1 News
Scalper1 News