Tag Archives: ycharts

CMS Energy Has Good Long-Term Prospects But Substantial Short-Term Hurdles

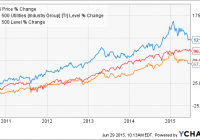
Summary Natural gas and electric utility CMS Energy’s share price has underperformed YTD after several years of outperforming both the utilities sector average and the S&P 500. The company possesses multiple long-term earnings drivers such as a favorable regulatory structure, a rebounding service area economy, and the presence of low energy prices. In the short-term, however, the company is faced with the combination of a heavy debt load and the prospect of rising interest rates. While I believe the company’s long-term drivers outweigh short-term hurdles for investors with lengthy investment horizons, its shares will likely be available for still less in the coming year. The share price of utility holding company CMS Energy (NYSE: CMS ) has been one of the top performers in the utility sector since the beginning of FY 2010, solidly beating both the sector as well as the S&P 500 (see figure). Value investors haven’t been provided with many opportunities in recent years to invest in the firm, however, due to the relative lack of undervaluation resulting from price downturns. The company’s share price has taken its largest tumble since the 2008 financial crisis in recent months, potentially making the company an attractive option for value investors. This article evaluates CMS Energy as a potential value investment in light of its recent earnings performance and current outlook. CMS data by YCharts CMS Energy at a glance CMS Energy is a Michigan-based public utility that provides electricity, nuclear power, uranium, and natural gas to customers throughout the state, including the Detroit metro. Its primary business segment is Consumers Energy, which as a regulated utility provides natural gas and electricity to more than 6 million customers, with coverage including the Upper Peninsula, via 6,000 MW of electricity generation capacity and 2,600 MW of power purchase agreements. The majority of its electric customers are residential, with the combination of residential and commercial customers contributing 84% of its electric gross margin in FY 2014. The utility generates electricity from a variety of fossil and renewable sources. In FY 2014 its portfolio consisted of 34% coal, 32% natural gas, 11% pumped storage, 9% renewables, 8% nuclear, and 6% oil. Recent state and federal regulations discourage the use of coal to generate electricity on environmental and human health grounds have caused CMS Energy to move away from the fuel, and by 2017 it expects Consumers Energy’s portfolio to be comprised of 37% gas, 24% coal, 12% pumped storage, 10% renewables, 8% nuclear, 6% oil, and 3% purchased. CMS Energy also conducts business via CMS Enterprises, which engages in independent power production and natural gas transmission. Consumers Energy generates the overwhelming majority of its parent company’s earnings, or 97% in Q1 2015. CMS Energy suspended its dividend during the financial crisis but reinstated it during the subsequent recovery and has become a reliable dividend generator in recent years, increasing its quarterly amount from $0.15 in FY 2010 to $0.29 today. The most recent increase from $0.27 of 7% was declared at the beginning of this year, bringing its forward yield at the time of writing to 3.6%. The company expects to maintain annual dividend growth of 5% over the next several years which, given its past record, is a feasible goal barring another major economic meltdown in Michigan. Q1 earnings report CMS Energy reported its Q1 earnings report in late April, missing on the top line and beating on the bottom. Revenue came in at $2.1 billion, down 16.3% from $2.5 billion (see table) and missing the consensus analyst estimate by $250 million. The decline was mostly due to the presence of much lower natural gas prices in Q1 2015 than in Q1 2014, which drove the average price charged to customers down by 60% compared to Q1 2005. Operating income fell by only 2.7% YoY to $397 million, however, due to a 19% operating expense decline YoY (again the result of low natural gas prices) almost entirely offsetting the revenue reduction. Q1 net income remained virtually unchanged, declining very slightly from $204 million to $202 million. This resulted in a diluted EPS number of $0.73, down slightly from $0.75 YoY but beating the consensus by $0.05. While the adoption of new mortality tables and a lower discount rate resulted in a hit to EPS of $0.08, the impact of these adjustments was more than offset by a $0.14 gain resulting from a very cold winter, with record natural gas and electricity sales recorded in February, and $0.04 from cost-cutting efforts. The YoY reductions to net income and EPS were largely the result of even colder weather being present in Q1 2014 and its most recent earnings were actually up 7% on a weather-normalized basis; overall Q1 2015 was the company’s 2nd-best result in at least a decade. CMS Energy Financials (non-adjusted) Q1 2015 Q4 2014 Q3 2014 Q2 2014 Q1 2014 Revenue ($MM) 2,111.0 1,758.0 1,430.0 1,468.0 2,523.0 Gross income ($MM) 983.0 852.0 775.0 746.0 948.0 Net income ($MM) 202.0 96.0 94.0 83.0 204.0 Diluted EPS ($) 0.73 0.35 0.34 0.30 0.75 EBITDA ($MM) 626.0 438.0 396.0 380.0 610.0 Source: Morningstar (2015). CMS Energy’s management reaffirmed its FY 2015 EPS guidance of $1.86-$1.89 in the wake of the earnings report’s release given the strength of the quarter. The company ended Q1 with $522 million in cash (see table), less than in Q1 2014 but still substantial in light of its asset growth and dividend increase. Its current ratio remained unchanged YoY at 1.6 while its interest coverage ratio remained solid at 2.8. Its balance sheet remains a concern, however, due to the large amount of long-term debt in the liabilities column. This increased by another $600 million over the previous four quarters to $8.1 billion at the end of Q1. While the debt is rated well, with S&P giving its secured and unsecured debt ‘A’ and ‘BBB’ ratings, respectively, its sheer size alone generated interest expenses in Q1 equal to 20% of the company’s operating income. CMS Energy Balance Sheet (restated) Q1 2015 Q4 2014 Q3 2014 Q2 2014 Q1 2014 Total cash ($MM) 522.0 207.0 493.0 358.0 758.0 Total assets ($MM) 19,198.0 19,185.0 18,381.0 17,719.0 17,924.0 Current liabilities ($MM) 1,599.0 2,014.0 1,648.0 1,563.0 1,801.0 Total liabilities ($MM) 15,396.0 15,515.0 14,711.0 14,074.0 14,306.0 Source: Morningstar (2015). Outlook CMS Energy’s outlook is a mixed bag, with positive long-term drivers being offset by negative short-term hurdles. The first of the positive drivers is the economic rebound that the state of Michigan is currently undergoing following Detroit’s bankruptcy. The state’s unemployment has fallen at a faster pace than the U.S. average rate (see figure) and the two are now equal. Furthermore, Michigan’s construction industry is bouncing back and construction payrolls have grown at twice the rate over the last five years of the U.S. average, signifying new buildings and therefore new utilities customers. The combination of increased electricity demand in particular and restrictions on coal-fired facilities has created a capacity shortfall within the state that is only expected to increase with time. Recognizing that this problem can only be solved via additional capacity, the company is moving forward with regulatory approval for the acquisition of a new natural gas-fired facility, which will in turn strengthen the company’s argument for future rate increases as compensation. There is a risk, of course, that regulators will instead opt to use power purchase agreements from 3rd-party generators, on which CMS Energy recognizes no profit, to cover the shortfall. This is mitigated by the second short-term driver: Michigan’s energy policy. Michigan Unemployment Rate data by YCharts Michigan’s legislature joined many other states earlier in the century by implementing a renewable portfolio standard that, among other things, required the state’s utilities to achieve a retail supply portfolio of 10% renewable electricity by 2015. That year has arrived, however, and Michigan has not extended and increased its RPS target. Instead its legislature is in the process of implementing a new energy policy that will instead utilize Integrated Resource Plans. Under these IRPs utilities propose multi-year forecasts of supply and demand alongside the most cost-effective means of meeting the forecasts. Utilities frequently prefer IRPs to RPSs since the latter are imposed on them whereas the former are largely directed by them. Some regulatory uncertainty can be expected to occur since IRPs don’t have the multi-decade horizons of RPSs, but CMS Energy’s recent investor presentations have supported the former despite this downside. IRPs are important from the perspective of capacity shortfalls since they allow traditional utilities to meet the shortfall via the types of capacity that they are most familiar with, such as natural gas-fired facilities, rather than via less established pathways such as renewables. Michigan already operates under a favorable regulatory system, with regulators recently permitting CMS Energy a ROE of 10.3% (which was admittedly less than the company had requested) and the replacement of Michigan’s RPS with an IRP framework could make this system still more favorable. The continued presence of low natural gas and coal prices can be expected to benefit CMS Energy further still (see figure). The company has already begun to pass its cost savings for both onto its customers in the form of lower retail prices, and regulators will likely view its future rate increase requests more favorably than they otherwise would as a result. Furthermore, low natural gas prices will encourage increased consumption, supporting its transmission and distribution operations. The company already intends to add another 170,000 natural gas customers in coming years via transmission capacity investments, and increased consumption per customer due to low prices will support this further still. The company also intends to increase its owned electricity generating capacity to 8,820 MW over the coming decade as its existing power purchase agreements expire, providing its electricity operations with additional income. CMS Energy should have little difficulty achieving 5% annual EPS growth over the next several years (management hopes to achieve an annual growth rate of up to 7%) based on these investments so long as Michigan’s economy remains steady. Michigan Natural Gas Citygate Price data by YCharts The short-term hurdle that worries me the most, however, is CMS Energy’s heavy long-term debt load and relatively high interest expenses even in the current low interest rate environment. This burden has the potential to grow even heavier in the next few quarters due to the likelihood that the Federal Reserve will increase interest rates for the first time in almost a decade. Shares of dividend stocks, utilities included, have moved broadly lower this year (see figure) in anticipation of higher interest rates as investors prepare to move into government and corporate bonds. While CMS Energy’s share price has underperformed the Dow Jones Utility Average since both peaked in late January, the difference is slight enough to suggest that the second affect of higher interest rates – larger interest payments for firms such as CMS Energy with heavy debt loads – isn’t entirely being factored in yet. The company intends to incur at least 50% more capital expenditures in the coming decade than in the last ten years, suggesting that its debt load will remain large for the foreseeable future. I expect that its share price will fall further when interest rates finally rise. CMS data by YCharts Valuation Analyst estimates for CMS Energy’s diluted EPS in FY 2015 and FY 2016 have remained unchanged over the last 90 days as the company’s management reaffirmed its EPS guidance. The FY 2015 consensus estimate is $1.88 while the FY 2016 consensus estimate is $2.01. Both results would, if achieved, represent the company’s best performance since at least FY 2000, indicating that analysts currently assume the presence of very favorable operating conditions over the next six quarters. Based on the company’s share price at the time of writing of $31.59, it has a trailing P/E ratio of 18.1x. Its FY 2015 and FY 2016 consensus estimates yield forward P/E ratios of 16.8x and 15.7x, respectively. While off of their January highs, all of these ratios are still well above their lows since 2012 (see figure). The company’s shares appear to be fairly-valued, if not slightly overvalued, based on their historical valuation range. CMS PE Ratio (NYSE: TTM ) data by YCharts Conclusion CMS Energy has much to offer to those investors looking for safe, dividend-bearing investments: an impressive share price track record, several years of sustained dividend and EPS increases, and a large presence in a rebounding economy that is overseen by a favorable regulatory system. Those investors with a multi-year investment horizon could certainly do worse than to initiate a long investment in the company at its current share price. I recommend waiting, however, until the first interest rate increase occurs later this year, as I believe that this will cause the company’s share price to decline still further in light of its large debt load and planned capex in the coming years. I expect that patient investors will be able to initiate long positions at 15x the firm’s estimated FY 2016 earnings, or $30.15 based on current forecasts, which would compensate them for the risk borne by the company’s debt load. Disclosure: I/we have no positions in any stocks mentioned, and no plans to initiate any positions within the next 72 hours. (More…) I wrote this article myself, and it expresses my own opinions. I am not receiving compensation for it (other than from Seeking Alpha). I have no business relationship with any company whose stock is mentioned in this article.

Unitil Corp.: Small And Dull Isn’t Necessarily A Bad Thing

Summary Electricity and natural gas distributor Unitil Corp. has seen its share price fall by 13% YTD even as its earnings were boosted by frigid winter conditions in its service area. The company has an impressive record, with its share price outperforming between FY 2010 and FY 2014 and strong net income and EPS CAGRs over the same period. A lack of market penetration in its service area and investments in expanded natural gas capacity should enable the company to continue its earnings growth trend in coming years. Its shares are not undervalued at present, although bearish sentiment from a rising interest rate could create an attractive long investment opportunity. Existing investors are encouraged to maintain their positions while potential investors are encouraged to initiate long positions if the share price falls below $30.40 in response to interest rate news. Electricity and natural gas distributor Unitil Corp. (NYSE: UTL ) has seen its share price and trailing diluted EPS move in opposite directions over the last several months, with the former falling by 13% since late February even as the company’s earnings were boosted by a harsh Northeast winter (see figure). The company has been an above-average performer on the S&P Utility Index since the beginning of FY 2010 and hasn’t reduced its dividend since its incorporation in 1984. This track record has not been enough to shield Unitil from the bearish sentiment that has afflicted the utility sector in anticipation of rising interest rates later this year, however. This article considers Unitil as a potential long investment in light of its falling share price and strong earnings YTD. UTL data by YCharts Unitil Corp. at a glance Unitil is a New Hampshire-based utility public holding company that provides electricity to 102,400 customers and natural gas to 75,900 customers in the states of New Hampshire, Massachusetts, and Maine. The company serves its customers via its five wholly-owned subsidiaries. Unitil Energy Systems is an electric distribution utility serving 74,000 customers in central New Hampshire, including Concord. Fitchburg Gas and Electric Light distributes electricity to 15,700 natural gas customers and 28,600 electricity customers in northern Massachusetts. Northern Utilities is a natural gas distribution utility with 62,200 customers in coastal New Hampshire and Maine, while Granite State Gas Transmission owns and operates an 86-mile underground natural gas pipeline that runs throughout Unitil’s subsidiary natural gas service areas in New Hampshire and Maine. While these subsidiary utilities are all regulated, Unitil also owns Usource LLC, which is an unregulated energy brokering and management firm that serves as agent for 1,200 customers. Unitil has been one of the better performers in the utility sector, with its shares outperforming both the S&P 500 and the S&P Utility Index between the beginning of FY 2010 and end of FY 2014 even as it has been largely ignored by analysts (only one analyst participated in its most recent earnings call ). This performance can be attributed to several factors, including access to inexpensive debt that has allowed it to finance a 54% increase in its net PP&E value, a favorable regulatory structure that has allowed it to report consecutive increases to ROE since FY 2012, and low customer penetration within its existing natural gas distribution system. The company has also benefited from its exposure to natural gas distribution, which has grown steadily since the end of 2011 (see figure) as increased shale gas extraction caused prices to plummet. This has been a boon to natural gas distributors in the form of rising sales volumes and revenues. Unitil has experienced CAGRs of 17% and 12% for its net income and diluted EPS, respectively, since FY 2012. Meanwhile, natural gas distribution now generates 55% of the company’s sales margin versus 45% for electricity (as of FY 2014). US Natural Gas Consumption data by YCharts Q1 earnings report Unitil reported very strong Q1 earnings at the end of April in the wake of an especially cold and snowy winter in the Northeast U.S. Consolidated revenue came in at $172.2 million, up 10.3% from $156.1 million YoY and beating the consensus estimate by 7.8% (see table). Natural gas revenue increased by 8.3% over the previous year’s Q1 to $100.3 million while electricity revenue increased by 13.6% to $70.3 million. The only subsidiary to report flat revenue was Usource, where revenue remained unchanged at $1.6 million. The revenue gains were driven by strong natural gas sales, which increased by 6.8% YoY; electric sales gained only slightly to 0.3%. The former’s strong performance was the result of a combination of the cold weather, with Q1 containing 4% more heating days versus the previous year and 14% more versus the long-term average, and FY 2014’s 3% increase in total customers. Unitil Corp. Financials (non-adjusted) Q1 2015 Q4 2014 Q3 2014 Q2 2014 Q1 2014 Revenue ($MM) 172.2 119.8 76.6 73.3 156.1 Gross income ($MM) 61.6 50.7 39.3 36.6 57.3 Net income ($MM) 13.6 9.4 1.6 1.1 12.6 Diluted EPS ($) 0.98 0.68 0.11 0.08 0.91 EBITDA ($MM) 39.8 31.3 18.5 17.4 35.8 Source: Morningsta r (2015). Gross income rose by 7.5% YoY due to a 6.3% increase to the consolidated natural gas sales margin and a 10.4% increase to the consolidated electricity sales margin. The distribution of the sales margin between natural gas and electricity remained almost unchanged from the previous Q1 at 63% and 37%, respectively (residential and commercial natural gas consumption peaks in the winter when heaters are running whereas electricity consumption is higher in the summer when air conditioners are in use, explaining the difference between the Q1 distribution and the FY 2014 distribution). These increases caused net income to improve by 8% YoY to $13.6 million from $12.6 million, resulting in a diluted EPS of $0.98 versus $0.91 YoY that beat the analyst consensus by $0.04. EBITDA rose to $39.8 million from $35.8 million the previous year. The EPS improvement and beat were both largely attributable to the winter weather, with management stating in the Q1 earnings call that the higher number of heating degree days boosted EPS by $0.02 compared to the previous year and $0.08 compared to the long-term average in the service area. The weather was not the only positive factor, however, as natural gas therm sales increased by 5% YoY on a weather-normalized basis due to a combination of more customers and the rapid fall in the price of natural gas that occurred in the second half of 2014. The impressive earnings performance brought Unitil’s trailing ROE up to 9.2% overall, compared to 8% and 8.2% in FY 2012 and FY 2013, respectively. Unitil ended the quarter with $11.2 million in cash, down from $14.3 million the previous year (see table) due to infrastructure investments over the previous four quarters. The company’s current ratio improved YoY from 1.11 to 1.28 despite this cash decrease, however, while its total assets grew by 12% thanks to an 11% increase to net PP&E compared to Q1 2014. While Unitil’s balance sheet isn’t as strong as some other utilities, in combination with the company’s earnings growth record it is sufficient to maintain a BBB+ credit rating from S&P. Furthermore, while cash on hand is not substantial, it is augmented by $88 million remaining in credit facility liquidity. Management was comfortable enough with the state of the company’s finances at the end of FY 2015 to increase the quarterly dividend by 1.4%, resulting in a forward yield of 4.2% based on an annual dividend of $1.40. While not as high as some of the bigger utility names – the widely-followed utility Southern Company (NYSE: SO ) has a forward yield of 5.2% at present – it is higher than the sector average. The iShares U.S. Utilities ETF (NYSEARCA: IDU ) has a 3.57% yield before expenses, for example. Unitil Corp. Balance Sheet (restated) Q1 2015 Q4 2014 Q3 2014 Q2 2014 Q1 2014 Total cash ($MM) 11.2 8.4 10.1 12.0 14.3 Total assets ($MM) 1,040.8 1,000.2 916.5 900.6 928.0 Current liabilities ($MM) 140.4 129.4 76.0 102.6 131.7 Total liabilities ($MM) 757.5 726.9 648.6 629.8 654.0 Source: Morningstar (2015). Outlook Unitil offers potential investors with a number of advantages over other utilities in addition to its high dividend yield. First, the company only has 60% penetration within its existing natural gas distribution system, leaving it with 50,000 potential future customers without the need for investment into expanded service areas. This gap allowed it to achieve a customer growth rate in FY 2014 that was 3x the region average. Furthermore, roughly 70% of the company’s existing natural gas distribution system is made of new, high-durability materials, minimizing the amount of capex that needs to be directed toward the replacement of existing capacity. Unitil therefore has the ability to generate continued earnings growth in coming years via existing capacity, supporting a continuation of its net income CAGR of 17%. Unitil is in the process of expanding its service areas to meet expected natural gas demand in the Northeast U.S. despite its ability to meet new customer growth with its current capacity. Northern Utilities is in the process of expanding its natural gas service areas to increase the company’s potential customer growth in coming quarters. Electricity isn’t being ignored either, with a sufficient number of new substations being constructed in New Hampshire to meet expected load growth in the state. There are a number of reasons to expect natural gas and electricity demand to increase in Unitil’s service area. First, the regional economy has fared quite well of late, with the unemployment rates in New Hampshire, Massachusetts, and Maine all falling well below the U.S. average (see figure). This trend, combined with the continued presence of inexpensive natural gas prices, will eliminate constraints on natural gas consumption. Finally, all three states benefit from their reliance on relatively clean feedstocks for electricity generation compared to other states. Coal as a source of electricity has come under a great deal of pressure from state and federal regulators in recent months. That fuel is responsible for only a small fraction of the electricity produced in Unitil’s service area, however, with nuclear power, natural gas, and renewables generating the vast majority of electricity there. Coal’s regulatory difficulties have boosted the fortunes of natural gas and will benefit those companies such as Unitil that generate income by distributing the latter. New Hampshire Unemployment Rate data by YCharts Valuation Analyst estimates for Unitil’s diluted EPS in FY 2015 and FY 2016 have remained quite stable over the last 90 days, reflecting the lack of volatility in the company’s outlook. The consensus estimate for FY 2015 has remained unchanged at $1.90 while that for FY 2016 has fallen only slightly from $2.00 to $1.98. While the presence of only two analyst estimates would normally call these numbers into question, the performance stability of regulated entities suggests that they will be close to the company’s actual results. If so, they will represent the company’s best earnings since at least FY 2010, continuing a growth trend that has been in place since that year. Unitil’s share price at the time of writing of $33.37 yields a trailing P/E ratio of 17.9x and forward ratios for FY 2015 and FY 2016 of 17.5x and 16.9x, respectively (see figure). All three of these numbers are solidly in the middle of their respective ranges since the beginning of 2012, suggesting that the firm’s shares are fairly valued at present. UTL PE Ratio (NYSE: TTM ) data by YCharts Conclusion Unitil Corp. has been something of an unsung hero among public regulated utilities over the last five years, outperforming both its sector and the broader market since the beginning of FY 2010 even as it has gone largely unnoticed by analysts. Both of these developments can be attributed in large part to the company’s focus on a small service area in a relatively rural part of the country. This lack of size and volatility shouldn’t deter investors, however, as the company’s recent track record has demonstrated. While I believe that Unitil is in a position to continue its record of steady earnings and dividend growth by increasing its market penetration within its existing service area and expanding its natural gas service area, the lack of a clear value argument at present and the prospect of bearish sentiment continuing to negatively impact utilities’ share prices as the first interest rate increase by the Federal Reserve in almost a decade grows closer prevent me from initiating a long investment at this time. Existing investors should hold their positions, however, and I will look to join them in the event that the company’s FY 2015 P/E ratio falls below 16x (or $30.40 based on the current consensus estimate). Disclosure: I/we have no positions in any stocks mentioned, but may initiate a long position in UTL over the next 72 hours. (More…) I wrote this article myself, and it expresses my own opinions. I am not receiving compensation for it (other than from Seeking Alpha). I have no business relationship with any company whose stock is mentioned in this article.

X-Raying CEFL (Part 3): Interest Rate Sensitivity

Summary Previous articles in this series investigated the leverage, expense ratio and geographical statistics of CEFL, a 2X leveraged CEF fund-of-funds. This article seeks to analyze the interest rate sensitivity of CEFL by comparing the performance of different classes of CEFs during the interest rate spike of 2015. How sensitive is CEFL to rising interest rates? Introduction This is Part 3 of a series of articles designed to “X-ray” into the holdings of the ETRACS Monthly Pay 2xLeveraged Closed-End Fund ETN (NYSEARCA: CEFL ) to allow investors to better understand the characteristics of the fund. CEFL tracks twice the monthly return of the ISE High Income Index [YLDA], an index that is comprised of high-yielding close-ended funds [CEFs]. The methodology used to construct YLDA has been summarized here . The YieldShares High Income ETF (NYSEARCA: YYY ) tracks the same index as CEFL. In the first article , the equity/debt, leverage and expense ratio of CEFL was analyzed. In the second article , the geographical allocation of CEFL was discussed. In the comment streams of the first two articles, I received a number of comments asking about the interest rate sensitivity of CEFL. This is an especially pertinent question given the mini-“Taper tantrum” that has occurred in early 2015. As the chart below shows, the U.S. 10-year treasury rate has increased from around 1.70% to a peak of 2.50% over short span of less than 6 months. 10 Year Treasury Rate data by YCharts Over the same time period, CEFL has dropped by -3.87% in price, although its total return has been +3.13% after dividends are accounted for. This suggests that CEFL has been holding up quite well despite the recent spike in interest rates. CEFL data by YCharts In this third article, I seek to analyze the debt holdings of CEFL to see how individual classes of CEFs fared during the recent interest rate spike. Methodology CEFL contains 30 CEFs, of which 7 are equity funds, 21 are debt funds and 2 are mixed funds. For this analysis, I only included the 21 debt funds as bonds are more sensitive to fluctuations in interest rates compared to stocks. For each debt CEF, I assigned it a primary classification for its largest type of debt holding (usually 40-100% of the total fund assets). I also assigned the CEF a secondary classification if its second-largest type of debt holding was at least 20% of the total fund assets. The classification types are: [i] corporate bonds [corp], [ii] government bonds [gov], [iii] securitized bonds [sec], which include various agency/commercial mortgage or asset-backed bonds, [iv] senior loans [loan], [v] convertible bonds [CB], and [vi] preferred shares [PF]. Note that this classification does not distinguish between U.S. and foreign bonds. The primary and secondary classifications of the 21 debt funds are shown in the table below. Fund Ticker Assets Primary Secondary DOUBLELINE INCOME SOLUTIO (NYSE: DSL ) 4.38% Corp Sec FIRST TRUST INTERMEDIATE (NYSE: FPF ) 4.28% Pref   EATON VANCE LIMITED DURAT (NYSEMKT: EVV ) 4.26% Loan Sec MFS CHARTER INCOME TRUST (NYSE: MCR ) 4.24% Corp Gov BLACKROCK CORPORATE HIGH (NYSE: HYT ) 4.20% Corp   WESTERN ASSET EMG MKT DBT (NYSE: ESD ) 4.18% Gov Corp PRUDENTIAL GL SH DUR HI Y (NYSE: GHY ) 4.11% Corp Gov PIMCO DYNAMIC CREDIT INCO (NYSE: PCI ) 4.11% Sec Corp MORGAN STANLEY EMERGING M (NYSE: EDD ) 3.88% Gov   ABERDEEN ASIA-PAC INCOME (NYSEMKT: FAX ) 3.43% Gov Corp PRUDENTIAL SHORT DURATION (NYSE: ISD ) 3.15% Corp   MFS MULTIMARKET INC TRUST (NYSE: MMT ) 2.84% Corp   BLACKSTONE/GSO STRATEGIC (NYSE: BGB ) 2.65% Loan Corp ALLIANZGI CONVERTIBLE & I (NYSE: NCV ) 2.42% CB Corp WESTERN ASSET HIGH INC FD (NYSE: HIX ) 2.19% Corp   BLACKROCK MULTI-SECTR INC (NYSE: BIT ) 1.89% Sec Corp WELLS FARGO ADV MULTISECT (NYSEMKT: ERC ) 1.56% Corp Gov ALLIANZGI CONV & INCOME I (NYSE: NCZ ) 1.35% CB Corp WELLS FARGO ADVANTAGE INC (NYSEMKT: EAD ) 1.33% Corp   NUVEEN PFD INC OPP FD (NYSE: JPC ) 1.12% Pref   INVESCO DYNAMIC CREDIT OP (NYSE: VTA ) 0.96% Loan Corp The performance of each class of debt CEF during the current interest rate spike (Feb. 1, 2015 to date) is compared with a benchmark ETF as identified using the correlation tool from InvestSpy . Corporate bonds 9 of the debt CEFs have corporate bonds as their primary holding, while 8 CEFs have corporate bonds as their secondary holding. All 9 debt CEFs that have corporate bonds as their primary holding are most correlated with the iShares iBoxx $ High Yield Corporate Bond ETF (NYSEARCA: HYG ). The following chart illustrates the 1-year correlation coefficients for these 9 funds arranged from highest to lowest correlation. The following chart shows the total return performance of the 9 debt CEFs with corporate bonds as their primary holding during the most recent interest rate spike compared to HYG from Feb. 1, 2015 to date. HYG Total Return Price data by YCharts We can see from the chart above that DSL has had the best total return performance of +4.98%, while GHY had the worst performance of -4.33% since Feb. 1, 2015. The average of the 9 CEFs was +0.28%, while the benchmark index HYG returned +1.14%. This indicates that the 9 debt CEFs with corporate bonds as their primary holding slightly underperformed the benchmark HYG over this time period. Government bonds 3 of the debt CEFs have government bonds as their primary holding, while 3 CEFs have government bonds as their secondary holding. Of the 3 debt CEFs that have government bonds as their primary holding, ESD and EDD are most correlated with the iShares J.P. Morgan USD Emerging Markets Bond ETF (NYSEARCA: EMB ), with 1-year coefficients of 0.51 and 0.60, respectively, while FAX is most correlated with HYG, with a coefficient of 0.29. Note that all three CEFs are actually either emerging market (ESD, EDD) or Asia-Pacific bond funds. The following chart shows the total return performance of the 3 debt CEFs with government bonds as their primary holding during the most recent interest rate spike compared to EMB and HYG from Feb. 1, 2015 to date. ESD Total Return Price data by YCharts We can see from the chart above that ESD has had the best total return performance of +0.67%, while EDD had the worst performance of -12.80% since Feb. 1, 2015. The average of the 3 CEFs was -6.22%, while the benchmark indices EMB and HYG returned +0.23% and +1.14%, respectively. This indicates that the 3 debt CEFs with government bonds as their primary holding significantly underperformed the benchmarks EMB and HYG over this time period. Senior loans 3 of the debt CEFs have senior loans as their primary holding. All 3 debt CEFs that have senior loans as their primary holding are most correlated with HYG. EVV, BGB and VTA have 1-year correlation coefficients to HYG of 0.40, 0.40 and 0.28, respectively. The following chart shows the total return performance of the 3 debt CEFs with senior loans as their primary holding during the most recent interest rate spike compared to HYG from Feb. 1, 2015 to date. The PowerShares Senior Loan Portfolio (NYSEARCA: BKLN ) is included for comparison. EVV Total Return Price data by YCharts We can see from the chart above that VTA has had the best total return performance of +5.35%, while EVV had the worst performance of +1.65% since Feb. 1, 2015. The average of the 3 CEFs was +3.53%, while the benchmarks HYG and BKLN returned +1.14% and +0.66%. This indicates that the 3 debt CEFs with senior loans as their primary holding significantly outperformed the benchmarks HYG and BKLN over this time period. Preferred shares 2 of the debt CEFs have preferred shares as their primary holding. JPC is most correlated with HYG (0.36), whereas FPF is, somewhat strangely, most correlated with the PowerShares Emerging Markets Sovereign Debt Portfolio (NYSEARCA: PCY ) (0.33). Therefore I have replaced PCY with the iShares U.S. Preferred Stock ETF (NYSEARCA: PFF ) in the following chart. JPC Total Return Price data by YCharts We can see from the chart above that JPC has had the best total return performance of +2.47%, followed by FPP at +0.26% since Feb. 1, 2015. The average of the 2 CEFs was +1.37%, while the benchmarks HYG and BKLN returned +1.14% and +0.11%. This indicates that the 2 debt CEFs with preferred shares as their primary holding slightly outperformed the benchmarks HYG and PFF over this time period. Convertible bonds 2 of the debt CEFs have convertible bonds as their primary holding. NCV and NCZ are both most correlated with the SPDR Barclays Convertible Securities ETF (NYSEARCA: CWB ), with 1-year correlation coefficients of 0.40 and 0.34, respectively. The following chart shows the total return performance of the 2 debt CEFs with convertible bonds as their primary holding during the most recent interest rate spike compared to CWB from Feb. 1, 2015 to date. NCV Total Return Price data by YCharts We can see from the chart above that NCV has had the best total return performance of -1.00%, followed by NCZ at -5.89% since Feb. 1, 2015. The average of the 2 CEFs was -3.45%, while the benchmark CWB returned +5.22%. This indicates that the 2 debt CEFs with convertible bonds as their primary holding significantly underperformed the benchmark CWB over this time period. Securitized bonds 2 of the debt CEFs have securitized bonds as their primary holding, while 2 CEFs have securitized bonds as their secondary holding. The 2 debt CEFs that have securitized bonds as their primary holding as both most correlated with HYG, with PCI and BIT having 1-year correlation coefficients of 0.54 and 0.44, respectively. The following chart shows the total return performance of the 2 debt CEFs with securitized bonds as their primary holding during the most recent interest rate spike compared to HYG from Feb. 1, 2015 to date. The iShares MBS ETF (NYSEARCA: MBB ) and the iShares CMBS ETF (NYSEARCA: CMBS ), which hold agency and commercial mortgage-backed bonds, respectively, are shown for comparison. PCI Total Return Price data by YCharts We can see from the chart above that PCI has had the best total return performance of +2.06%, followed by BIT at -0.33% since Feb. 1, 2015. The average of the 2 CEFs was +0.87%, while the benchmarks HYG, MBB and CMBS returned +1.14%, -0.50% and -1.32%, respectively. This indicates that the 2 debt CEFs with securitized bonds as their primary holding slightly outperformed the benchmark HYG over this time period. Discussion What does this all mean for investors? One major finding that resulted from this analysis is that most of the CEF debt classes in CEFL (including corporate bonds, senior loans, preferred shares and convertible bonds)* are most correlated with the high-yield ETF HYG. This bodes well for investors in CEFL who are worried about rising interest rates since high-yield debt is less interest-rate sensitive compared to investment-grade debt. (*Note that BKLN and PFF did not show up in the top-10 ETFs most correlated with the senior loans or preferred shares CEFs, respectively, indicating that InvestSpy might have for some reason excluded these ETFs from its correlation tool.) Indeed, inputting CEFL into the Investspy’s correlation tool indicates that has been the most correlated with HYG, EMB, JNK, PCY and CWB over the past 1-year, as shown in the chart below (but note that the past 1 year includes the final six months of 2014 which are before the rebalancing of CEFL to its present constituents). Encouragingly, all five of these ETFs and CEFL have outperformed the iShares iBoxx $ Investment Grade Corporate Bond ETF (NYSEARCA: LQD ) (-4.75%), the iShares 7-10 Year Treasury Bond ETF (NYSEARCA: IEF ) (-3.46%) and the iShares 20 Year Treasury Bond ETF (NYSEARCA: TLT ) (-12.7%) during the interest rate spike of 2015. This is not surprising because investment-grade debt and treasuries are much more sensitive to interest rates, as mentioned above. The total return performances of these ETFs are shown in the chart below. CEFL Total Return Price data by YCharts In terms of the individual debt classes of CEFL, CEFs with corporate bonds (as their primary holding) averaged +0.28%, government bonds averaged -6.22%, senior loans averaged +3.53%, preferred shares CEFs +1.37%, convertible bonds -3.45%, and securitized bonds +0.87% since Feb. 1st, 2015. The strongest performance of senior loan CEFs (+3.55%) may be rationalized by the fact that these are normally floating-rate instruments that may benefit as interest rates rise, although it should also be noted that the benchmark ETF BKLN was essentially flat over this time period. A quick check on CEFConnect shows that the premium/discount of the three senior loan CEFs (EVV, BGB, VTA) was steady over this time period, suggesting either that the CEF managers were able to outperform the benchmark or that the other components in the CEFs were responsible for the outperformance. Conversely, the weakest performance of the government bond CEFs (-6.22%) may also be understood on the basis that this debt is relatively interest rate-sensitive, although again the benchmark index EMB was actually also flat over this time period. This time, however, the discounts for the three CEFs in question (FAX, ESD, EDD) actually widened by about 2 to 4 percentage points over this time period, indicating that the discount expansion could account for a significant fraction of the underperformance of these CEFs. Moreover, this observation indicates investor pessimism regarding these CEFs, which are actually all emerging market or Asia-Pacific bond funds. The total return performance of the six classes of debt CEFs within CEFL since Feb. 1st, 2015 are summarized in the chart below. Conclusion Based on this analysis of CEF performances during the interest rate spike of 2015, I conclude that CEFL is not very interest rate-sensitive, and investors therefore do not have to unduly worry over the effect of increasing interest rates on CEFL. The main findings supporting this conclusion are: Most of the holdings of CEFL are most-correlated with high-yield debt, which is not very interest rate-sensitive. The five ETFs that are most correlated with CEFL all outperformed investment-grade bonds LQD and treasuries IEF and TLT since Feb. 1, 2015. CEFL itself outperformed LQD, IEF and TLT over the same time period. CEFL contains three senior loan CEFs, which are typically floating rate instruments, and these may provide protection against increasing interest rates. The main limitations of this analysis are: The premium/discount of the individual funds were not studied. Seeking Alpha contributor Lance Brofman has calculated the overall discount of CEFL to be 9.5% on Jun. 1, 2015, an increase compared to 8.6% a month prior, but the overall discount on Feb. 1, 2015 was not determined. The 10-year treasury rate increased from 1.70% to a peak of 2.50% over the past 5 months. Therefore, this analysis may not be valid for interest rate increases that are much greater in magnitude or velocity (although this seems to be an unlikely scenario at the present time). This analysis is only valid until Dec. 31, 2015, when CEFL becomes repopulated with different CEFs due to rebalancing. Finally, as a 2X leveraged fund, the cost of maintaining the leverage of the CEFL (based on 3-month LIBOR) would go up as interest rates rise. While not having an immediate effect on NAV, this effectively increases the total expense ratio of the fund, leading to a drag on NAV over time. I hope this information will be helpful for investors in or considering investing in this fund. Disclosure: I am/we are long CEFL. (More…) I wrote this article myself, and it expresses my own opinions. I am not receiving compensation for it (other than from Seeking Alpha). I have no business relationship with any company whose stock is mentioned in this article.