Tag Archives: yahoo

Price Stability In An ETF: The Appeal Of Guggenheim Defensive Equity
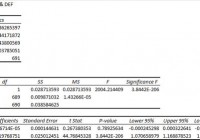
Summary I’m taking a look at DEF as a candidate for inclusion in my ETF portfolio. The only weakness I see is that the ETF has a higher expense ratio as it turns over assets more frequently than I would want. The correlation and standard deviation is very attractive. The data is based on solid liquidity, so feel it is fairly reliable. I’m keeping DEF in the running for my entire portfolio due to the price stability of the ETF. Investors should be seeking to improve their risk adjusted returns. I’m a big fan of using ETFs to achieve the risk adjusted returns relative to the portfolios that a normal investor can generate for themselves after trading costs. I’m working on building a new portfolio and I’m going to be analyzing several of the ETFs that I am considering for my personal portfolio. One of the funds that I’m considering is the Guggenheim Defensive Equity ETF (NYSEARCA: DEF ). I’ll be performing a substantial portion of my analysis along the lines of modern portfolio theory, so my goal is to find ways to minimize costs while achieving diversification to reduce my risk level. What does DEF do? DEF attempts to track the total return (before fees and expenses) of the Sabrient Defensive Equity Index. At least 90% of the assets are invested in funds included in this index. DEF falls under the category of “Large value”. Does DEF provide diversification benefits to a portfolio? Each investor may hold a different portfolio, but I use the SPDR S&P 500 Trust ETF (NYSEARCA: SPY ) as the basis for my analysis. I believe SPY, or another large cap U.S. fund with similar properties, represents the reasonable first step for many investors designing an ETF portfolio. Therefore, I start my diversification analysis by seeing how it works with SPY. I start with an ANOVA table: (click to enlarge) The correlation is 86%. That is a reasonable correlation level under Modern Portfolio Theory. Lower levels of correlation allow more of the risk associated with individual investments to be effectively diversified away. For an ETF that will hold several large U.S. equity securities, that’s a very appealing level of correlation as long as the liquidity is good. Standard deviation of daily returns (dividend adjusted, measured since April 2012) The standard deviation is amazing. For DEF it is .576%. For SPY, it is 0.748% for the same period. SPY usually beats other ETFs in this regard. Because the standard deviation is fairly low and the correlation is pretty good, I’m expecting to see substantial diversification benefits that would make DEF a reasonable fit in most portfolios. Liquidity is moderate Over my sample period the average trading volume was around 35,000 shares per day. Over the last ten days it was over 55,000. Mixing it with SPY I also run comparisons on the standard deviation of daily returns for the portfolio assuming that the portfolio is combined with the S&P 500. For research, I assume daily rebalancing because it dramatically simplifies the math. With a 50/50 weighting in a portfolio holding only SPY and DEF, the standard deviation of daily returns across the entire portfolio is 0.639%. Notice that this is significantly lower than SPY alone. With 80% in SPY and 20% in DEF, the standard deviation of the portfolio would have been .700%. If an investor wanted to use DEF as a supplement to their portfolio, the standard deviation across the portfolio with 95% in SPY and 5% in DEF would have been .735%. Why I use standard deviation of daily returns I don’t believe historical returns have predictive power for future returns, but I do believe historical values for standard deviations of returns relative to other ETFs have some predictive power on future risks and correlations. Yield & Taxes The distribution yield is 2.5%. It’s a reasonable yield for an investor trying to avoid excessive trading costs. A decent distribution yield can help investors avoid feeling a need to open their portfolio up too frequently. Expense Ratio The ETF is posting .66% for a net expense ratio. I want diversification, I want stability, and I don’t want to pay for them. I view expense ratios as a very important part of the long term return picture because I want to hold the ETF for a time period measured in decades. I’m not thrilled with the expense ratio, but it can be tricky to find ETFs with such a low standard deviation of returns and moderate correlation. Market to NAV The ETF is at a .02% premium to NAV currently. Premiums or discounts to NAV can change very quickly so investors should check prior to putting in an order. The ETF is large enough and liquid enough that I would expect the ETF to stay fairly close to NAV. Generally, I don’t trust deviations from NAV and I will have a strong resistance to paying a premium to NAV to enter into a position. I wouldn’t worry about .02%. Largest Holdings The diversification within the ETF may be a substantial part of the lower standard deviation. (click to enlarge) Conclusion This ETF looks like a contender. In the interest of reducing the deviation of returns I find defensive funds appealing as part of a diversified portfolio. The correlation at 86% isn’t too bad and the fund still showed decent returns and holds some of the same companies as SPY while being less volatile. There are some clear diversification benefits here. If an investor was going to hold only SPY or DEF over the next 20 years, I’d expect SPY to end higher. However, the appealing aspect of DEF is that it can reduce the risk of the portfolio. In the context of a more complicated portfolio that is being rebalanced and contains some more volatile ETFs, I like the role of DEF. The average liquidity isn’t too bad. The days with no change in dividend adjusted close is high enough to give me a little concern (18), but there were no days that actually reported 0 trading volumes. Therefore, I think the liquidity is fairly decent and I wouldn’t treat it as a major concern. Having a decent distribution yield doesn’t hurt either in the context of a long term investor. There’s only one area that concerns me. The ETF is posting a fairly high expense ratio relative to the other strong contenders for this space in my portfolio. The portfolio turnover is also very high at 87%. That surprised me a bit. For a defensive ETF, I would expect less shifting in the positions. For comparison, SPY has a turnover ratio of 3%. One strike against the ETF won’t be enough to eliminate it from consideration. I’ll admit that the largest position being Staples makes me scratch my head a little bit, but the position was still under 1.5% so I’d say the diversification is solid and I wouldn’t worry about it. Investors should notice that the ETF does also hold some significant positions in REITs. That doesn’t bother me, but each investor has a different situation. I was expecting to use an ETF dedicated to REITs to increase my exposure in that regard. Disclosure: The author has no positions in any stocks mentioned, and no plans to initiate any positions within the next 72 hours. (More…) The author wrote this article themselves, and it expresses their own opinions. The author is not receiving compensation for it (other than from Seeking Alpha). The author has no business relationship with any company whose stock is mentioned in this article. Additional disclosure: Information in this article represents the opinion of the analyst. All statements are represented as opinions, rather than facts, and should not be construed as advice to buy or sell a security. Ratings of “outperform” and “underperform” reflect the analyst’s estimation of a divergence between the market value for a security and the price that would be appropriate given the potential for risks and returns relative to other securities. The analyst does not know your particular objectives for returns or constraints upon investing. All investors are encouraged to do their own research before making any investment decision. Information is regularly obtained from Yahoo Finance, Google Finance, and SEC Database. If Yahoo, Google, or the SEC database contained faulty or old information it could be incorporated into my analysis. The analyst holds a diversified portfolio including mutual funds or index funds which may include a small long exposure to the stock.
Short-Term VIX Futures Products Should Be Avoided Until Better Opportunities Arise

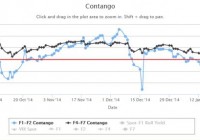
All four major VIX short-term futures ETPs are negative over the past six months. Backwardation has occurred much more frequently in the past three months. The VIX is signaling a lack of direction in the market. In this article, my main theme will be what the VIX futures are saying about the market and why you should be patient. We will take a look at some popular VIX ETFs such as the ProShares Ultra VIX Short-Term Futures ETF (NYSEARCA: UVXY ), the ProShares Short VIX Short-Term Futures ETF (NYSEARCA: SVXY ), the VelocityShares Daily Inverse VIX Short-Term ETN (NASDAQ: XIV ), and the iPath S&P 500 VIX Short-Term Futures ETN (NYSEARCA: VXX ). As you can see below, VIX futures have been in backwardation quite frequently, especially when compared to 2012, 2013, and the beginning of 2014. Last month, I published an article that recommended a shift in focus from the pure contango and backwardation strategy to the percentage of backwardation strategy. You can view that article here . I continue to recommend this strategy given the current market conditions. (click to enlarge) Over the past three years, we have enjoyed a relatively subdued VIX. Historically, this is not abnormal in a bull market. However, as seen in the chart below, these periods (within the last 25 years) have only lasted, at most, about five years. (click to enlarge) Chart obtained from Yahoo! Finance by Nathan Buehler If you have followed my past publications, you know I take an optimistic view towards the U.S. economy. I continue to be concerned about the level of debt and liabilities within the U.S. government. It seems, as a global economy, debt has become an acceptable part of the budget. Living beyond your means for a long period of time will eventually have consequences. When those consequences will affect the economy is when politicians begin to address the problem. I don’t see that happening anytime in the near future. The Federal Reserve has undoubtedly, in my opinion, been the number one driver of the VIX for the past five years. Through massive amounts of monetary stimulus and an ever reassuring tone, it has encouraged the market to record highs. My takeaway from current events is that the Federal Reserve will continue to support the market and the U.S. economy at any cost. I expect to see low rates for the foreseeable future unless inflation begins to run over the proposed targets. The current VIX is signaling a lack of direction in the market. There is uncertainty surrounding U.S. monetary policy going forward. When will rates rise and by how much are common questions being discussed. Global growth has been revised downward several times. Investors are unsure if the U.S. can continue to sustain growth in these challenging conditions. This is exactly what the VIX is intended to measure, uncertainty and fear. It is currently right on target. Both UVXY and VXX have outperformed their inverse counterparts over the past three months. This is especially positive for VXX considering it does not have the leverage that UVXY provides. This is something we have not seen, for a prolonged period of time, since 2011. All four instruments are negative over the past six months. As of 2/6/2015, VXX was down less than 1% over the same time period. (click to enlarge) Chart made by Nathan Buehler using historical VIX data obtained from the CBOE As you can see from the data above, over the past 11 years, we have only seen backwardation drop below -10% (significantly) five times. Given the current global economic outlook, I would not be surprised to see the VIX futures testing a -10% backwardation level sometime in 2015. When uncertainty in the VIX presents itself, the best tool to have in your investing portfolio is patience. Sometimes you will have missed opportunities, or feel that way, until you are rewarded for waiting patiently. You only need one correct trade a year in the VIX to outperform the major benchmarks. I have been extremely cautious over the last several months and it has paid off. Nothing has presented enough potential reward to balance the current risk. These back and forth swings in the market only decay the value of short-term ETPs (pro and inverse). My strategy has always been to short the VIX once “extreme” levels are breached. Different periods of economic activity dictate different levels of “extreme”. This strategy can be executed through purchasing inverse products, shorting pro-VIX products, options, or a combination. Please see my library and Instablog for more information on specific strategies. My current recommendation is to avoid all the short-term VIX-related products until a better opportunity presents itself. None of these products are buy-and-hold investments. If you have any questions or are new to trading the VIX, please view my library of articles to gain a better understanding of your risks. As 2015 progresses, I will continue to publish updates on the VIX futures and its related ETPs. I highly appreciate you reading and hope you find this information helpful in your investing decisions. Disclosure: The author has no positions in any stocks mentioned, and no plans to initiate any positions within the next 72 hours. (More…) The author wrote this article themselves, and it expresses their own opinions. The author is not receiving compensation for it (other than from Seeking Alpha). The author has no business relationship with any company whose stock is mentioned in this article.

Sell Your Employer, Get VTI Instead

Summary Many employees hold stock in the company that employs them. Taking advantage of plans that offer a discount on stock makes sense, but don’t let it overwhelm your portfolio. By not rebalancing frequently enough, employees may find themselves with diversifiable risk. The excess risk provides no excess (expected) return, and the risk isn’t just having too much of one company in your portfolio. I’m suggesting investors take a better look at replacing their employer’s stock with VTI whenever the option is available. The last week I’ve been doing a great deal of research on behavioral finance. There are several potential pitfalls for investors to avoid, but most investors are not familiar with behavior finance. I’ll be highlighting several of those pitfalls so readers can watch out for them. My focus in this article is why the Vanguard Total Stock Market ETF (NYSEARCA: VTI ) is a better investment than your employer. I can’t say that VTI will provide better returns, but I am confident that the expected return for the level of risk will be superior. Two problems with owning your employer: Problem #1 The first problem should be fairly clear to most investors. Holding individual companies is a fine way to invest, but it creates a substantial amount of diversifiable risk if individual companies are a large part of the portfolio or if multiple companies within the same industry are being selected. When the position in the employer reaches higher levels, say 10 or 15%, it becomes a substantial risk factor for the portfolio. Two problems with owning your employer: Problem #2 The second problem is one that many intelligent people manage to completely overlook. The second risk factor is that you are exposing the value of your portfolio to the same risk factors that are impacting the value of your lifetime earnings. Let’s start with an extreme example: Enron Long-term employees had ample opportunity to build up substantial positions in the company stock. When a company goes out of business, the employees are facing unemployment. If they also held the stock, they risk seeing the value of their portfolio decline substantially. If the firm employs a substantial number of people with their skill set within the geographic area, several former employees may be faced with needing to move in order to find new work. The concentration of that skill set exceeding the number of available positions makes it an unfortunate situation that is even more significant for employees that own their home and will be facing transaction costs on selling the house. Industry risk On top of the company-specific risk, there is also a level of industry risk. If the company is closing locations because the industry is less profitable, finding a job with a competitor will be more difficult. It would be preferable for the employee to have less than normal exposure to his industry within his portfolio. Whether the firm is in biotech or car manufacturing, the price that the employee’s skill set can command in the free market is still dependent upon supply and demand within the industry. Solving the problem There are two ways to solve this problem. An investor can either attempt to build a diversified portfolio that intentionally has less than normal allocation to their industry. However, I think it is much simpler and more cost efficient, due to trading commissions, to simply buy the Vanguard Total Stock Market ETF. I’ve heard people lately talking about how the stock market is being valued too highly. I think some of those analysts raise very legitimate concerns. However, I also believe that market timing has a negative expected value. Attempting to find the right time to jump in may be viable for individual companies, but trying to find the right time for buying the entire market is another challenge entirely. When was the right time to buy? In my opinion, several decades ago would have been great. Since that isn’t an option, I favor investing in the total market at the present time. Is this the perfect moment? I doubt the timing is perfect. Whichever day you buy into the market, there may well be a day in the future that offers a lower price. Buying into the market and having the value never dip under the entry price has more to do with being lucky than good. How I’m doing it Over the next couple months, I’ll be overhauling my positions. The vast majority of my positions are in tax advantaged accounts, so I’m not concerned about the ramifications of capital gains. I’ll do the rebalancing as soon as I finish with filing taxes for 2014. I need to know how I’m going to split up my contributions to Traditional and Roth IRA accounts. I don’t know if the market will move up or down during that time, but I expect VTI to be trading right about NAV due to the enormous trading volume. For investors not familiar with VTI, the average is over 3 million shares per day. I’ll buy at whatever the price happens to be at the time, and I’ll be investing over half of my total investment portfolio. Why VTI? When I started looking at ETFs for my portfolio, I started looking at SPDR S&P 500 Trust ETF (NYSEARCA: SPY ). I started running historical numbers comparing the volatility of portfolios that included ETFs with exposure to several investing factors. I included emerging markets, precious metals, bonds, and bonds in other currencies. What I found was that it was possible (historically) for an investor to find better returns and lower risk through a global portfolio. However, the returns did not take into account any trading costs and the difference was not very substantial. After seeing how well SPY was able to do against the much more complicated portfolios, I decided it would be better to try to replicate it. VTI offers extremely high correlation to SPY, which isn’t surprising given how many of the same equities are being held. However, VTI is offering exposure to smaller cap companies without having such a large position that it would substantially alter the returns. The result is an ETF that offers extremely similar performance to SPY with a slightly lower expense ratio. For VTI it is .05%, for SPY it is .09%. Conclusion If an investor is holding stock in their employer, it would be prudent to consider swapping the position for VTI or SPY. If the position is required as part of a program that allows employees to buy the company stock at a discount to the market price, it may be reasonable to retain the amount of stock required by the program. For any excess cash being invested, VTI or SPY offers dramatically lower risk for the investor’s life. The risk is not simply the standard deviation of the portfolio value. Investors need to be aware that holding their employer exposes their portfolio to precisely the same risks that their career is facing. That is a risk that all investors should seek to diversify. Disclosure: The author has no positions in any stocks mentioned, and no plans to initiate any positions within the next 72 hours. (More…) The author wrote this article themselves, and it expresses their own opinions. The author is not receiving compensation for it (other than from Seeking Alpha). The author has no business relationship with any company whose stock is mentioned in this article. Additional disclosure: Information in this article represents the opinion of the analyst. All statements are represented as opinions, rather than facts, and should not be construed as advice to buy or sell a security. Ratings of “outperform” and “underperform” reflect the analyst’s estimation of a divergence between the market value for a security and the price that would be appropriate given the potential for risks and returns relative to other securities. The analyst does not know your particular objectives for returns or constraints upon investing. All investors are encouraged to do their own research before making any investment decision. Information is regularly obtained from Yahoo Finance, Google Finance, and SEC Database. If Yahoo, Google, or the SEC database contained faulty or old information it could be incorporated into my analysis. The analyst holds a diversified portfolio including mutual funds or index funds which may include a small long exposure to the stock.