Tag Archives: yahoo

Investing For Retirement Using Schwab Mutual Funds
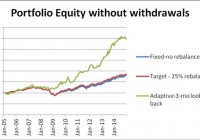
Summary Schwab offers a set of diversified mutual funds which can be successfully used for construction of investment portfolios with good withdrawal rates. A set of just three mutual funds, a bond, a large cap dividend equity growth, plus a small cap fund generates good returns with relatively low risk. From January 2005 to January 2015, a Schwab portfolio with fixed allocation could produce a safe 5% annual without any substantial decrease of the capital. Same portfolio with rebalancing at 25% deviation from the target allowed a safe 5% annual withdrawal rate with a smaller decrease of the capital. Same portfolio with momentum-based adaptive allocation could have produced a safe 10% annual withdrawal rate and 0.52% annual increase of the capital. This article belongs to a series of articles dedicated for investing in various mutual fund families. In previous articles we reported our research on Fidelity, Vanguard, T Rowe Price, and American Century mutual fund families. The current article does the same for Schwab family of mutual funds. The series of these articles is aimed at a broad spectrum of investors. They may be useful to small individual investors as well as to any large institution managing retirement accounts. The general methodology we use in selecting the funds for the portfolio was presented in a previous article. The portfolio includes three funds: one bond fund and two equity funds. The equity funds are complementary: one covers large capitalization stocks paying high dividends, the other fund contains small capitalization growth stocks. Historically, the selected funds have performed better than most other funds in their category. The mutual funds been selected for investment are the following: Schwab total bond market fund (MUTF: SWLBX ) Schwab Dividend Equity fund (MUTF: SWSCX ) Schwab Small Cap Equity fund (MUTF: SWDSX ) As in the previous articles, three different strategies are considered: (1) Fixed asset allocation. The portfolio is initially invested 50% in the bond fund and 50% equally divided between the two stock funds, without rebalancing. (2) Target asset allocation with rebalancing. The portfolio is initially invested 50% in the bond fund and 50% equally divided between the two stock funds and is rebalanced when the allocation to any fund deviates by 25% from its target. (3) Momentum-based adaptive asset allocation. The portfolio is at all times invested 100% in only one fund. The switching, if necessary, is done monthly at closing of the last trading day of the month. All money is invested in the fund with the highest return over the previous 3 months. The data for the study were downloaded from Yahoo Finance on the Historical Prices menu for three tickers: SWLBX, SWSCX, and SWDSX. We use the monthly price data from January 2005 to January 2015, adjusted for dividend payments. The paper is made up of two parts. In part I, we examine the performance of portfolios without any income withdrawal. In part II, we examine the performance of portfolios when income is extracted periodically from the accounts. Part I: Portfolios without withdrawals We report the performance of the portfolios under two scenarios: (1) no withdrawals are made during the time interval of the study, and (2) withdrawals at a fixed rate of the initial investment are made periodically. In table 1 we show the results of the portfolios managed for 10 years, from January 2005 to January 2015. Table 1. Portfolios without withdrawals 2005 – 2015. Strategy Total increase% CAGR% Number trades MaxDD% Fixed-no rebalance 79.75 5.98 0 -31.09 Target-25% rebalance 86.22 6.36 3 -31.09 Momentum-Adaptive 247.20 13.25 36 -14.74 The time evolution of the equity in the portfolios is shown in Figure 1. (click to enlarge) Figure 1. Equities of portfolios without withdrawals. Source: This chart is based on EXCEL calculations using the adjusted monthly closing share prices of securities. From figure 1 it is apparent that the rate of increase of the adaptive portfolio is substantially greater than the rate of the fixed and target allocation portfolios. Part II: Portfolios with withdrawals Assume that we invest $1,000,000 for income in retirement. We plan to withdraw monthly a fixed percentage of the initial investment. That amount is increased by 2% annually in order to account for inflation. In table 2 we show the results of the portfolios managed for 10 years, from January 2005 to January 2015. Money was withdrawn monthly at a 5% annual rate of the initial investment plus a 2% inflation adjustment. Over the 10 years from January 2005 to January 2015, a total of $535,920 was withdrawn. Table 2. Portfolios with 5% annual withdrawal rate 2005 – 2015. Strategy Total increase% CAGR% Number trades MaxDD% Fixed-no rebalance -0.21 -0.02 0 -36.32 Target-25% rebalance -0.01 -0.00 3 -37.39 Momentum-Adaptive 126.32 8.51 36 -20.50 The time evolution of the equity in the portfolios is shown in Figure 2. (click to enlarge) Figure 2. Equities of portfolios with 5% annual withdrawal rates. Source: This chart is based on EXCEL calculations using the adjusted monthly closing share prices of securities. To illustrate the advantage of the adaptive allocation strategy and the effect of withdrawal rates on the evolution of the capital, we give in Table 3 the results of simulations for the following withdrawal rates: 0%, 5%, 10%, and 12%. Table 3. Adaptive Portfolios with various annual withdrawal rates 2005 – 2015. Withdrawal rate % Total increase% CAGR% MaxDD% 0 247.20 13.25 -14.74 5 126.32 8.51 -20.50 8 53.77 4.40 -25.64 10 5.40 0.52 -30.04 The time evolution of the equity in the portfolios is shown in Figure 3. (click to enlarge) Figure 3. Equities of momentum-based portfolios with various annual withdrawal rates. Source: This chart is based on EXCEL calculations using the adjusted monthly closing share prices of securities. Conclusion The set of three Schwab mutual funds, selected for this study, perform well for all three strategies and generate sustainable returns at relatively low drawdowns. Between 2005 and 2015, the fixed target allocation with rebalancing was able to sustain withdrawal rates of up to 5% annually. The adaptive allocation algorithm was able to sustain withdrawal rates up to 10% annually without any decrease of capital. Additional disclosure: This article is the fifth in a sequence on investing in mutual funds for retirement accounts. To help the reader compare the past performance of various mutual fund families, I selected a benchmark 10-year time interval starting on 1 January 2005 and ending on 31 December 2014. The article was written for educational purposes and should not be considered as specific investment advice. Disclosure: The author has no positions in any stocks mentioned, and no plans to initiate any positions within the next 72 hours. (More…) The author wrote this article themselves, and it expresses their own opinions. The author is not receiving compensation for it (other than from Seeking Alpha). The author has no business relationship with any company whose stock is mentioned in this article.
This Is How You Invest In Oil Right Now (Without USO)

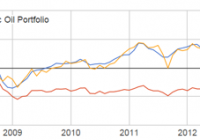
Summary Many investors are making big bets on oil since it bottomed last month. However, the oil futures curve is in extreme contango, making ETFs like USO and USL very costly. Until the curve flattens, non-integrated oil drillers are a much safer play. This article presents a dynamic model for oil investing to better capitalize on an oil turnaround. Note: This article originally appeared on Hedgewise in October 2014. It has been updated with additional data and republished. Introduction Just about everyone is betting on an oil turnaround sometime soon and trying to figure out how to capitalize on it. Unfortunately, most instruments that provide exposure to oil prices are riddled with high long-term holding costs. One of the most popular oil ETFs, The United States Oil ETF (NYSEARCA: USO ), often suffers from paying high premiums on futures contracts (called “contango”). As you can see here , these costs are particularly severe right now. Investing directly in companies which drill, distribute, or sell oil is a reasonable alternative, but these companies often fail to track the spot price of oil very closely. For example, in 2008, when oil went up 200% , Exxon Mobil (NYSE: XOM ) was only up 88%. This article breaks down the nature of this problem, and presents a dynamic methodology for investing in oil that seeks to avoid these pitfalls. A back-tested simulation that applies this logic can be seen in the graph below, under the label “Dynamic Oil Portfolio.” This portfolio is a rule-based index that invests in a single oil futures contract when the market is in backwardation, or a non-integrated oil company ETF when it is not. It significantly outperforms a long-term investment in USO, and has drastically outperformed in the last few months. This methodology can be applied to any portfolio by keeping track of current market conditions, and then choosing the appropriate ETF (or futures contract) accordingly. Comparison of the WTI Oil Spot Price, USO, and the Dynamic Oil Portfolio, May 2006 – February 2015 (click to enlarge) Sources: Energy Information Administration, Yahoo Finance, Hedgewise Internal Research The Problem First, it is worthwhile to do a quick review of the problems with investing in oil. The most direct way to invest is with an oil futures contract, which commits you to buying oil at an agreed upon price at some point in the future. Unfortunately, much of the time there is a premium on the price of oil futures, called “contango,” because people are betting the price of oil will go up. For example, say the current spot price of oil was $50, and you could buy a futures contract for next month at $55. If the price of oil were to stay exactly flat for the next month, you would probably lose about $5 on that contract. If this were to keep happening, you would lose about 10% per month for the entire year! How This Applies to Oil ETFs The effect of this problem can be seen by examining the performance of ETFs that specialize in trading oil futures contracts. For example, USO has a policy of rolling over the nearest oil futures contract every month. This results in significant cost whenever the market is in contango, which explains its underperformance over time. The iPath S&P Crude Oil Total Return ETN (NYSEARCA: OIL ) and the United States 12 Month Oil ETF (NYSEARCA: USL ) are affected in a similar way. Performance of USO, OIL, and USL vs. WTI Oil Spot Price, December 2007 – February 2015 (click to enlarge) Sources: Energy Information Administration, Yahoo Finance You might notice that USL has performed the best. This is because USL invests in 12 different futures contracts at all times while OIL and USO only invest in the futures contract of the nearest month. This has helped to avoid some of the dramatic costs of trading futures in periods of heavy speculation, such as early 2009. However, it is not enough to avoid the problem altogether. Still, the relative performance of USL provides an important insight. Since different oil futures contracts trade at different prices, there is an opportunity to pick the cheapest one at any point in time. This is the mandate of the PowerShares DB Oil ETF (NYSEARCA: DBO ), and, in theory, should lead to improved performance. Unfortunately, in practice, it has not. Performance of USL and DBO vs. WTI Oil Spot Price, December 2007 – February 2015 (click to enlarge) Sources: Energy Information Administration, Yahoo Finance The main reason that DBO has failed to outperform USL is because of the consistency of the futures curve. It is often upward sloping over time, such that the adjusted cost is about the same no matter which contract you buy. It is helpful to zoom in on different time periods to get a better sense of how this works. You might have already observed how well DBO and USL performed from January 2008 to January 2009. We can examine the futures curve over that time period to understand why this was possible. Note that a “2-Month Oil Futures” contract is one that expires 2 months from today, and a “4-Month Oil Futures” contract is one that expires 4 months from today. If the “4-Month” price is higher than the “2-Month” price, this indicates that the market is in contango. WTI Oil Spot Price vs. 2-Month and 4-Month Futures Contract Prices, January 2008 to January 2009 (click to enlarge) Source: Energy Information Administration The important observation is how close the price of both futures contracts was to the spot price over this entire period. In fact, at some points, the price of the futures contracts was actually below the spot price, which is a case of backwardation. This allowed USL and DBO to outperform. However, this trend changed dramatically in 2010. WTI Oil Spot Price vs. 2-Month and 4-Month Futures Contract Prices, January 2010 to January 2011 (click to enlarge) Source: Energy Information Administration Here, the futures curve was upward sloping, with the price of the 4-Month contract consistently above that of the 2-Month contract. As a result, all of the ETFs involved in trading oil futures suffered. This demonstrates the general point that if you are going to get oil exposure using futures (whether directly or via ETFs), you need to be constantly monitoring the futures curve and adjusting accordingly. When the curve is upward sloping, trading futures will cost a hefty sum over the long term. Unfortunately, this has been the case about 60% of the time over the past decade. Thus, it is necessary to identify alternative ways to get oil exposure, such as investing directly in individual companies. Investing Directly in Oil Companies The most obvious candidates for direct investing are the two largest energy ETFs, the Energy Select Sector SPDR ETF (NYSEARCA: XLE ) and the Vanguard Energy ETF (NYSEARCA: VDE ). Both ETFs invest in most of the biggest energy companies in the world. Performance of XLE and VDE vs. WTI Oil price, June 2006 – February 2015 (click to enlarge) Sources: Energy Information Administration, Yahoo Finance This performance is not terrible, but there is a great deal of tracking error. While in this period the overall effect has been positive, it could just as easily have been negative as it was from 2008 to 2009. The nature of this tracking error can be traced back to the fundamentals of the oil market. First, most large energy companies are grouped into the ‘oil & gas’ sector. This is because natural gas is often found alongside oil, and comprises a significant part of their business. However, the price movements of natural gas are often uncorrelated to the price movements of oil. Second, there are three main functions in the oil industry. Exploration and drilling Equipment and transportation Retail sales Many of the big oil players are involved in all three functions, but equipment, transportation, and retail sales don’t really depend on the current price of oil. For example, if you are selling oil equipment, you would not expect short-term oil fluctuations to change your sales outlook. If you are a gas station, you receive a small mark-up on the price of oil after buying it wholesale. Only exploration and drilling companies (a.k.a., ‘non-integrated’ oil companies) have very direct exposure to oil prices since they are the ones who actually own the oil fields. The good news is that there are ETFs which track these non-integrated oil companies. Two of the largest are the iShares U.S. Oil & Gas Exploration & Production ETF (NYSEARCA: IEO ) and the SPDR S&P Oil & Gas Exploration & Production ETF (NYSEARCA: XOP ). Performance of IEO and XOP vs. WTI Oil Spot Price, June 2006 – February 2015 (click to enlarge) Sources: Energy Information Administration, Yahoo Finance Surprisingly, these stocks actually have an even higher tracking error. To understand why, we have to take a look at the largest actual holdings within the ETFs. XOP primarily invests in smaller-sized owner-operators of oil fields, such as Magnum Hunter Resources Corp. (NYSE: MHR ) and Western Refining, Inc. (NYSE: WNR ). Performance of MHR and WNR vs. WTI Spot Oil Price, June 2006 – February 2015 (click to enlarge) Sources: Energy Information Administration, Yahoo Finance The problem is that these small companies are hugely susceptible to swings due to idiosyncratic factors, like their recent discoveries and the prospects for their particular oil fields. As such, they are fairly uncorrelated to the price of oil. It makes more sense to focus on companies which are diversified across many oil sources rather than only a few, which is the focus of IEO. Two of their biggest holdings are the Anadarko Petroleum Corporation (NYSE: APC ) and EOG Resources, Inc. (NYSE: EOG ), both big drilling companies. Performance of APC and EOG vs. WTI Spot Oil Price, June 2006 – February 2015 (click to enlarge) Sources: Energy Information Administration, Yahoo Finance There is still company-specific variance, but it is muted because these companies are better diversified. Because of this, IEO is likely a better play on oil exposure than XOP. However, it remains unclear whether IEO is a better option than the bigger ETFs; XLE and VDE. Unfortunately, there is no way to make a determination on numbers alone. All three of the ETFs hold oil companies that also invest in natural gas. Each of those companies will have independent factors that affect it year to year. It seems logical that non-integrated oil companies would be more directly exposed to fluctuations in the oil price than the bigger players involved in equipment, transportation, and retail sales. Yet, their relative performance suggests the difference thus far has been pretty negligible. All three are probably reasonable alternatives when the futures market is in contango. Performance of IEO, XLE, and VDE vs. WTI Spot Oil Price, June 2006 – February 2015 (click to enlarge) Sources: Energy Information Administration, Yahoo Finance How to Apply the Model The outcome of all this logic is relatively simple. Invest in the cheapest futures contract (optimizing between USO, USL, and DBO if using an ETF) when there is a downward sloping futures curve, and use a general energy ETF like IEO, XLE, or VDE otherwise. While this requires a little extra work, it may drastically reduce the costs of investing in oil over the long run. We’ve also made this a little easier for you by tracking the current state of the futures curve and its estimated impact on each ETF (linked above). Though the outcome of this model is not perfect, it is certainly more compelling than many of the alternatives. Disclosure: Hedgewise is an Investment Advisor that helps clients implement custom strategies like the one described in this article inexpensively and tax-efficiently. This information does not constitute investment advice or an offer to invest or to provide management services and is subject to correction, completion and amendment without notice. Hedgewise makes no warranties and is not responsible for your use of this information or for any errors or inaccuracies resulting from your use. To the extent that any of the content published may be deemed to be investment advice or recommendations in connection with a particular security, such information is impersonal and not tailored to the investment needs of any specific person. Hedgewise may recommend some of the investments mentioned in this article for use in its clients’ portfolios. Disclosure: The author is long IEO, XLE. (More…) The author wrote this article themselves, and it expresses their own opinions. The author is not receiving compensation for it. The author has no business relationship with any company whose stock is mentioned in this article.

Buy Russia: Now A Bargain At Just About 6 Times Earnings

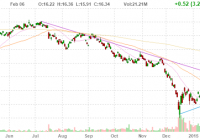
Russian stocks are very cheap at just over 6 times earnings and should be appealing for bargain hunters and contrarians. Weak oil prices have hurt Russia’s economy, but oil may have bottomed out and could rise in the future. The issue with Ukraine remains a wild card, but it appears that all parties have too much to lose and that means a resolution could be likely. The plunge in oil prices and the increasingly stiff sanctions over Russia’s foray into Ukraine have taken a big toll on the economy and the stock market. The negative headlines are likely to continue for awhile when it comes to Ukraine, but as far as the price of oil goes, things seem to be looking up thanks to a recent rebound. I am wary about investing in Russia because the geopolitical risks are significant and there are also currency and other risks. However, when valuations get to very cheap levels, it is hard to resist buying a bargain. Because of the numerous ongoing risks, I can’t allow myself to invest heavily in Russian stocks, but the cheap valuation makes me want to buy small position in the Market Vectors Russia ETF (NYSEARCA: RSX ). Let’s take a closer look: (click to enlarge) As the chart above shows, this ETF was trading for about $26 per share in July 2014, but has since plunged into the low teens. However, it is worth noting that since December, there has been a solid rally as indicated by the light blue uptrend line. Over the last few weeks, oil also appears to have bottomed out and if so, this is a major positive for Russia’s economy. Even so, that leaves the risk of war and sanctions. The sanctions have certainly started to impact the Russian economy, and it could not really come at a worse time because of the plunge in oil prices. If oil prices were still around $80 to $100 per barrel, I believe that Russia could afford to take a more protracted and antagonistic stance when it comes to Ukraine. The fact that oil is about 50% below the 2014 highs, makes me think that Putin will want to be a little more negotiable when it comes to finding solutions with the West that could lift sanctions. Over the last few days, Putin has been meeting with Germany’s Merkel, President Hollande of France, Ukraine’s leader, Petro Poroshenko and other leaders in order to find solutions. If these talks fail, the chance of war might increase which could cause Russian stocks to re-test recent lows. There is a lot at stake for all parties, especially for Russia and many European nations because of significant trade and because they rely on Russian natural gas. In a worst case scenario, Putin could shut off natural gas pipelines to Ukraine and Europe which would be a real blow to those economies. While those are significant risks, it seems like too much is at stake and I don’t see what any of the parties have to gain by escalating matters. On the positive side, if oil has bottomed out and if a cease fire is agreed to and sanctions are eventually lifted, Russian stocks could have significant upside. Russia is here to stay and this nearly perfect storm of weak oil prices and sanctions might be a fantastic buying opportunity. The Market Vectors Russia ETF has a price to earnings ratio of just about 6.5 times earnings. Right now, the S&P 500 Index (NYSEARCA: SPY ) trades for nearly 18 times earnings. The Market Vectors Russia ETF has significant exposure to the oil industry as well as other commodities. Below, you can see the top ten holdings : (data sourced from Yahoo Finance) Top 10 Holdings (57.78% of Total Assets) Chris DeMuth Jr. is a Seeking Alpha contributor, and I believe he is also an extremely savvy investor. He recently wrote about the opportunities in Russia and pointed out metrics which show just how cheap the Russian market is now, he states : “Concerns about Russia have driven down the price of its equity market. Russia’s total market cap is only 17% of its GDP, one of the lowest in the world. This is its historical minimum and far below its maximum of 142% during the past fifteen years. Over the past eight years, its GDP has grown by over 13% per year.” Marc Faber is a well-known investor, and he is also seeing a potential buying opportunity when it comes to Russian equities. He believes Central Banks have inflated asset prices through money printing but that “low valuations” in Russia are worth considering. His views were discussed in a Bloomberg article which stated: “Russian assets may move into some kind of a buying range,” Faber told an investor briefing in London. “They can go lower but they’re moving into a buying range.” Shares in the MSCI Russia index trade at an 80 percent discount to their U.S. counterparts based on their price-to-earnings ratio, compared with an average discount of 50 percent since 2003, Datastream data showed. Russian assets are clearly cheap, and could get cheaper. You should expect volatility to continue. Because of this it makes sense to buy only a small amount and average in over time. It also makes sense to have a long-term time frame. Ten years from now, I doubt the “Ukraine Crisis” will still be top headline news and I also doubt oil will be trading for $50 per barrel. If that is the case, a little investment in Russia could pay off big in the future. Data is sourced from Yahoo Finance. No guarantees or representations are made. Hawkinvest is not a registered investment advisor and does not provide specific investment advice. The information is for informational purposes only. You should always consult a financial advisor. Disclosure: The author is long RSX. (More…) The author wrote this article themselves, and it expresses their own opinions. The author is not receiving compensation for it (other than from Seeking Alpha). The author has no business relationship with any company whose stock is mentioned in this article.