Tag Archives: utilities

Higher Rates And Improved U.S. Labor Market Hold Back SLV

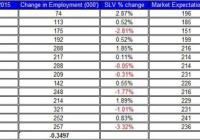
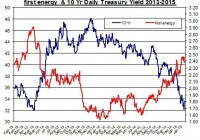
The price of SLV declined by 9% since its high a few weeks back. The recent Non-farm payroll passed expectations and coincided with the decline of SLV. The markets have revised up their expectations for a rate hike in mid-2015. The latest non-farm payroll report showed a better-than-expected result of 257,000 jobs gain in January – the market expectations were at 236,000. This news contributed to the latest fall in iShares Silver Trust ETF (NYSEARCA: SLV ), which lost 3.3% on Friday and nearly 9% from its high back in January 22nd. Here are the latest developments in the U.S. economy and its relation to the progress of SLV. The table below shows the relation between the changes in the non-farm payroll and the price of SLV in the past few reports. This time, the non-farm payroll came well above market expectations, which has led to a fall in the price of SLV. Another positive result was the revisions for December and November, which, combined, reached 147,000 more jobs than previously estimated. (click to enlarge) Source of data taken from Bureau of Labor Statistics The latest U.S. labor report also showed a higher-than-previously seen gain in wages – a 2.2% rise in hourly wages, which is the biggest gain since November 2008. This could be one of the main indicators that the FOMC has been looking for in determining its next move. If the recent rise in wages will put them on a higher path for growth, this could suggest the policy the FOMC has been implementing in recent years could come to an end within a few months. These recent positive results on both the number of jobs and gain in wages could bring the FOMC one step closer towards raising rates, which could, at the very least, curb down the rally of SLV. U.S. treasury yields have started to pick up again, which tends to move in the opposite direction to SLV; i.e. when yields rise, the price of SLV tends to decline. This was the case in recent weeks. Moreover, based on the latest update by the CME , the probability of a rate hike in the June meeting has increased to 27% – a month ago this probability was around 17.4%. For the July meeting, the probabilities are even higher at 50% compared to 37% a month back. So not for nothing, the market has also revised up its expectations for mid-year rate hike. But the ongoing economic slowdown and economic uncertainty in Europe could bring back down U.S. treasury yields. If yields were to resume their descent, as they did earlier this year, this trend could start pressuring back up SLV. In the meantime, the developments in Europe including the QE program and the tensions between the Greeks and the Germans over policy is likely to bring further down the Euro against leading currencies including the US dollar. Moreover, the recent decisions of Bank of Canada and Reserve Bank of Australia to reduce their cash rates are only bringing up the U.S. dollar. The ongoing recovery of the U.S. dollar against major currencies could start to adversely impact the price of SLV, albeit in recent weeks the correlations among major currency pairs and SLV were relatively weak, as indicated in the chart below. Source of data taken from Bloomberg The silver lining for silver bugs is that the strengthening of the U.S. dollar could also, down the line, start to weigh on the progress of the U.S. economy and taper down its growth. After all, a stronger dollar may reduce the competitive edge of U.S. exports, increase trade deficit and cut imported inflation. Therefore, if this trend persists, it may eventually start to have an adverse impact on the U.S. economic recovery, which could benefit SLV investors. The silver market isn’t an investment for the faint of heart, which is characterized with high volatility. The ongoing recovery in the U.S. economy is likely to keep pushing down the price of SLV. But from the other side, the global economic mess we face, especially in Europe, could bring down U.S. treasury yields and thus also increase the demand for precious metals. These two opposing forces are likely to keep SLV zigzagging in the near term. For more see: Is SLV about to change course? Disclosure: The author has no positions in any stocks mentioned, and no plans to initiate any positions within the next 72 hours. (More…) The author wrote this article themselves, and it expresses their own opinions. The author is not receiving compensation for it (other than from Seeking Alpha). The author has no business relationship with any company whose stock is mentioned in this article.

Is FirstEnergy’s Rally Driven By Low U.S. Treasury Yields?

Summary FirstEnergy’s stock added nearly 30% in the past six months. Have low U.S. treasury yields increased the demand for FirstEnergy? What are the other factors that could also drive up shares of FirstEnergy? Shares of FirstEnergy (NYSE: FE ) have added nearly 30% to their value in the past six months. The common notion is that falling U.S. treasury yields tend to increase the demand for utility companies such as FirstEnergy. But is this the case? Also, what are some of the other factors that could drive up the price of FirstEnergy? Do U.S. treasury yields matter? To answer this question, let’s examine the relation of the 10 year treasury yield and the movement in FirstEnergy’s stock over the last couple of years. Source of data taken from Google Finance and U.S. Treasury At first glance we can see in times when treasury yields have gone down, as was the case in recent months, the stock of FirstEnergy rallied and vice versa. But after reviewing the linear correlation between the two sets of data – the correlation for the period was only -0.05 – it’s harder to make the case for a strong relation between U.S. treasury yields and FirstEnergy. But still the relation could be more a matter of people slowly moving their funds to utility companies such as FirstEnergy rather than having a direct clear cut reaction to these changes in the market. In other words, the relation could be more in the trend line than in the day to day shifts. This could all change if the FOMC were to start to raise its cash rate in the second half of the year, which should increase treasury yields. One of the main reasons people like to invest in utility companies such as FirstEnergy is for its stability and relatively high yields. The current annual dividend yield is 3.6%. In comparison, Exelon (NYSE: EXC ) and Duke Energy (NYSE: DUK ) also offer similar dividend yields of 3.4% and 3.7%, respectively. But these factors aren’t the only reasons for the higher demand for FirstEnergy. Here are a few of more reasons to consider: The company is also aiming to expand its operations: FirstEnergy is in the midst of a potential of $7 billion investment in transmission across 24,000 mile transmission system in its Regulated Transmission segment – which transmits electricity through transmission facilities. Back in 2014 the company allocated $4.2 billion for this investment, which is expected to conclude in 2017 and result in the upgrade and expansion of the transmission system. For 2014, the company estimated capex for this project to reach $1.35 billion. These investments will be funded via debt, issuing stocks, employment benefits and cash. Electricity generation is expected to rise in 2015 Based on the latest report by the Energy Information Administration , consumption of electricity in the residential sector is expected to slightly decline by 0.3% in 2015, year over year. This is mainly due to 12% drop in heating degree days this year compared to 2014. Despite the lower demand for electricity in the residential sector, electricity generation is still projected to rise by 1.1% in 2015. Moreover, the EIA also estimates retail residential prices to rise by 1.1% in 2015. This could suggest higher revenue for utility companies such as FirstEnergy. The company will release its fourth quarter report at the end of February, in which the company may provide an update on its guidance for 2015. Lower coal and natural gas prices Another thing that plays in favor for FirstEnergy is the currently low coal and natural gas prices. The company’s fuel mix includes 57% coal and 8% natural gas. The current price of coal (Central Appalachian) is around $46 per short ton – back in early 2014 the price was close to $60 per short ton. Moreover, natural gas is roughly $2.6. In comparison, back in February 2014 the price of natural gas was over $5. The low energy prices are likely to improve FirstEnergy’s profit margin in the first quarter of 2015 and subsequent quarters, assuming coal and natural gas prices remain at their current low levels. Takeaway FirstEnergy is benefiting from low energy prices, falling U.S. treasury yields and potential rise in retail prices in the coming months. These factors are likely to keep the company an interesting investment opportunity. Disclosure: The author has no positions in any stocks mentioned, and no plans to initiate any positions within the next 72 hours. (More…) The author wrote this article themselves, and it expresses their own opinions. The author is not receiving compensation for it (other than from Seeking Alpha). The author has no business relationship with any company whose stock is mentioned in this article.

ProShares Doubles Dividend Growth ETF Lineup

Summary ProShares recently launched two new dividend growth ETFs. A look at the methodology behind the underlying dividend indices. The ETFs include companies with a history of raising dividends. By Todd Shriber & Tom Lydon Looking to build on the success of the ProShares S&P 500 Aristocrats ETF (NYSEArca: NOBL ) , ProShares doubled the size of its dividend growth ETF suite today with the introduction of two new funds. Joining NOBL and the ProShares MSCI EAFE Dividend Growers ETF (NYSEArca: EFAD ) as ProShares dividend growth ETFs are the ProShares Russell 2000 Dividend Growers ETF (NYSEArca: SMDV ) and the ProShares S&P MidCap 400 Dividend Aristocrats ETF (NYSEArca: REGL ) . Like, NOBL, the ProShares S&P MidCap 400 Dividend Aristocrats ETF tracks a dividend aristocrats index. The midcap dividend aristocrats index requires 15 consecutive years of increased dividends for inclusion whereas NOBL’s underlying index requires a minimum dividend increase streak of 25 years. REGL’s index is equal-weighted. The new ETF allocates a combined 47.6% of its weight to the utilities and financial services sectors with industrials and consumer staples combining for another 28.7%, according to ProShares data . The ProShares Russell 2000 Dividend Growers ETF, a dividend spin on the Russell 2000, the benchmark U.S. small-cap index, tracks the Russell 2000 Dividend Growth Index. That index includes small-cap firms with dividend increase streaks of at least a decade. Index constituents are screened for liquidity and dividend status, then selected and equal weighted subject to a maximum sector weight of 30%, according to Russell Investments. SMDV allocates almost 30.2% of its weight to financial services stocks, an overweight of more than 600 basis points to that sector relative to the Russell 2000. The new ETF also features a combined 34.3% weight to materials and utilities stocks. Those sectors combine for just over 8% of the Russell 2000. “Over the past 28 years, U.S. equities that grew dividends year over year returned 13.9%, while those that paid them without growing them returned 10.1%, according to Ned Davis Research. The findings are based on an analysis of companies underlying the Russell 3000 Index, a measure of the broad U.S. equities market, from February 2, 1987 through December 31, 2014,” said ProShares in a statement. Investors have gravitated to dividend growth ETFs , including NOBL. NOBL is just 16 months old and is already home to over $600 million in assets. The ETF was named ETF Product of the Year at the William F. Sharpe Indexing Achievement Awards. REGL and SMDV, the new ProShares dividend ETFs, each charge 0.4% per year. ProShares Russell 2000 Dividend Growers ETF Sector Weights Table Courtesy: ProShares Disclosure: The author has no positions in any stocks mentioned, and no plans to initiate any positions within the next 72 hours. (More…) The author wrote this article themselves, and it expresses their own opinions. The author is not receiving compensation for it. The author has no business relationship with any company whose stock is mentioned in this article.