Tag Archives: undefined

Left Smarting – Smart Beta Products May Not Make Bad Decisions But They Do Facilitate Them

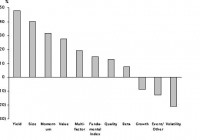
By Kevin Murphy ‘But guns don’t kill people, people do’ is a line less likely to settle an argument than provoke further discussion and yet it is not impossible to imagine an advocate of so-called ‘smart beta’ investments – strategies that try to build on simple index-tracking products by focusing in on a specific factor, such as growth, momentum or value – using a similar refrain. “But smart beta products don’t make bad investment decisions, investors do,” they might tell a doubter. To which we would reply – as we would to anyone trying the gun line – “OK, but they do make the job a lot easier.” We touched on this idea of smart beta products exacerbating investors’ well-documented inability to judge when to buy into and sell out of markets in, among other articles, Smart thinking . That piece was inspired by some fascinating work by our friends at Empirical Research Partners and, since they have recently returned to the subject, we shall too. What Empirical has done is to look at two relationships – first, between past performance and where investors put their money and, second, between where investors put their money and subsequent performance. As you can see from the chart below, for eight out of the 11 categories of smart beta strategies analysed, there is a very strong positive correlation between past performance and future fund flows, with those directing money towards yield-type exchange traded funds (ETFs) apparently the most prone to invest with at least one eye on the rear view mirror. Source: Strategic Insight Simfund, Empirical Research Partners Analysis, June 2015 Here on The Value Perspective, we have no major philosophical issue with investors putting money into areas that have performed well, if – and it is a big if – they continue to perform well. So did Empirical identify any sort of positive relationship between performance in consecutive quarters? Did funds that performed well continue to do so? The answer, as you can see from the following chart, is ‘not really’. Source: Strategic Insight Simfund, Empirical Research Partners Analysis, June 2015 Indeed, returns to yield ETFs are so mean-reverting that, as Empirical observes: “If anything, investors should be buying them after down-quarters rather than up-quarters.” As value investors, we also cannot resist pointing out how momentum ETFs have a negative correlation here too – after all, the one quality investors might think they could count on from such a strategy would be, well, momentum. One final aspect of Empirical’s research we would highlight is the finding that, on average, smart beta strategies turn over about a third of their total capitalisation every month. This would of course imply the average holding period for a smart beta investor is three months – in other words, the average holding period mirrors the time frames of fund flows and performance discussed above. The picture being painted here is of a dispiriting and, to our minds, frankly nonsensical investment routine, where your average smart beta investor sees good performance, buys it, sells up after a quarter of likely disappointing performance, buys something else that has performed well, sells up after a quarter of likely disappointing performance and on and on until, presumably, they have no money left. No doubt, the groups that run smart beta strategies would argue they are intended to allow investors to tilt their exposure to factors they believe will deliver strong performance over the longer term. The reality seems to be, however, that that is not how many people use them – choosing instead to churn smart beta ETFs in the hope of squeezing the best possible performance from quarter to quarter. As we never tire of pointing out here on The Value Perspective, nothing in life is certain but, if anything came close, it would be that such a hope is destined to end in disappointment. Ultimately, one of the supposed selling points of smart beta ETFs – the ease with which investors can pick out and trade a particular strategy – is working against them. Instead of tangible companies, complete with management teams, business models and financial statements, ETF investors are buying into ethereal concepts that are based on other people’s definitions of value or momentum, say – and, if one does not work, it is significantly easier to give up and buy an alternative. That of course is the antithesis of what value investors look to do, preferring instead to play the patient, long-term game, with an average holding period of three or five years.

Investors Bulk Up On Bank ETFs And Options

Summary The markets anticipate the Federal Reserve will hike interest rates some time this year. Financial sector ETFs could outperform in a rising rate environment. More investors are shifting money into financial sector ETFs. By Todd Shriber & Tom Lydon Concerns that the Federal Reserve is close to raising interest rates are of no concern at all for investors in financial services exchange traded funds, one of the most prolific asset-gathering corners of the ETF space in recent months. Rising Treasury yields have been a driving force behind financial services sector ebullience. Put simply, interest rates play a significant role in investors’ attitude toward bank stocks and ETFs. Investors are responding by pouring into ETFs such as the Financial Select Sector SPDR ETF (NYSEARCA: XLF ) and the corresponding bullish options. “For every 100 bullish contracts on the Financial Select Sector SPDR Fund, 112 puts were outstanding. That’s near the highest ratio since 2012, data compiled by Bloomberg show. Options protecting against a 10 percent drop in the ETF cost 6.16 points more than calls betting on a 10 percent rise, three-month data show. The spread, known as skew, reached 5.07 on June 16, the lowest since July,” reports Lu Wang for Bloomberg . XLF, the largest financial services ETF, has hauled in $811.5 million in new assets this month, after adding nearly $545 million in new assets last month. Inflows to financial services ETFs, including XLF, arrived after professional investors shunned the sector in the first quarter . The May flows to bank ETFs are interesting when accounting for seasonal trends, which highlight June weakness for the financial services sector. On a historical basis, XLF is the worst of the nine SPDRs in the sixth months of the year. Wells Fargo (NYSE: WFC ), Warren Buffett’s Berkshire Hathaway (NYSE: BRK.B ) and Dow component JPMorgan Chase (NYSE: JPM ) combine for over a quarter of XLF’s weight. “The Fed will raise rates for the first time since 2006 in September and lift them to at least 1.5 percent next year, according to the median forecast of more than 50 economists in a Bloomberg survey,” according to the news agency. Although money has been piling into ETFs like XLF in recent months, investors have taken a more muted approach to leveraged equivalents. For example, the ProShares Ultra Financials ETF (NYSEARCA: UYG ) , the double-leveraged answer to the iShares U.S. Financial Services ETF (NYSEARCA: IYG ) , has not added any new money this month. The Direxion Russel 1000 Financials Bullish 3X ETF (FAS ) , which attempts to deliver triple the daily returns of the Russell 1000 Financial Services Index, has added over $8 million this month. FAS and UYG are up 4.5% and 3.3%, respectively, over the past month. Direxion Russel 1000 Financials Bullish 3X ETF (click to enlarge) Disclosure: I/we have no positions in any stocks mentioned, and no plans to initiate any positions within the next 72 hours. (More…) I wrote this article myself, and it expresses my own opinions. I am not receiving compensation for it. I have no business relationship with any company whose stock is mentioned in this article.

M&A Activity Stokes Inflows To Healthcare Providers ETFs

Summary Increased industry consolidation could help support healthcare provider ETFs. Healthcare services ETFs attracting greater investment demand. The healthcare sector is booming on a wave of new clients as more enroll into the ACA. By Todd Shriber & Tom Lydon Buoyed by rumors that the health insurance industry is poised for consolidation on a grand scale, the iShares U.S. Healthcare Providers ETF (NYSEARCA: IHF ) has been steadily rising and raking in new assets. As of June 23, IHF added $247 million in new assets this year, the ETF’s biggest first-half inflows since it came to market in 2006, reports Joseph Ciolli for Bloomberg . Up 19.4% year-to-date, it is now home to $987.4 million in assets under management. For weeks, investors and the financial media have been expecting a wave of consolidation that could see marriages among some of IHF’s largest holdings. Earlier this week, Cigna (NYSE: CI ) rejected a $47 billion takeover offer from Anthem (NYSE: ANTM ). Anthem and Cigna are IHF’s fourth- and fifth-largest holdings, respectively, combining for over 13% of the ETF’s weight. Dow component UnitedHealth (NYSE: UNH ) has made overtures for rival Aetna (NYSE: AET ) while Aetna has been reportedly eying Humana (NYSE: HUM ), according to the Wall Street Journal . UnitedHealth, Aetna and Humana combine for about 23% of IHF’s weight. “Fueling the potential consolidation is the Obama administration’s 2010 health law, which put tougher rules on the industry, demanding more covered services, better care and a ceiling on profits. Companies are racing to capture the more than 20 million customers who will buy coverage under the law,” according to Bloomberg. Inflows to IHF are accelerating, including $138.1 million in the current quarter. In March 2014, the ETF had just $400 million in assets under management. Investors are also taking note of IHF’s equal-weight rival, the SPDR S&P Health Care Services ETF (NYSEARCA: XHS ) . XHS now has nearly $191 million in assets, $25 million of which have arrived this quarter. The ETF has added $54.1 million in new assets this year. Cigna, Aetna, Anthem, UnitedHealth and Humana combine for 10% of XHS’s weight. The ETF is up 15.8% this year. IHF and XHS are not strangers to healthcare mergers and acquisitions. Earlier this year, UnitedHealth agreed to acquire Catamaran (NASDAQ: CTRX ) for $12.8 billion in cash. In 2009, Express Scripts (NASDAQ: ESRX ) spent $4.7 billion to acquire WellPoint and followed up that deal with the $29 billion acquisition of Medco in 2012. Last month, shares of Quest Diagnostics (NYSE: DGX ), the provider of healthcare diagnostic testing services, after it was rumored that company could be a takeover target as well though chatter to that effect has since ebbed. Quest Diagnostics is 2.6% of IHF and 2% of XHS. iShares U.S. Healthcare Providers ETF (click to enlarge) Disclosure: I/we have no positions in any stocks mentioned, and no plans to initiate any positions within the next 72 hours. (More…) I wrote this article myself, and it expresses my own opinions. I am not receiving compensation for it. I have no business relationship with any company whose stock is mentioned in this article.