Tag Archives: undefined

TYNS Is An Inferior Inverse Bond ETF

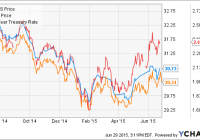
Summary TYNS has very low AUM. TYNS is very illiquid. TYNS charges a fee that siphons off returns. Over the last month I have written extensively about inverse bond ETFs. Not all inverse bond ETFs are made equally though, so my goal is ultimately to dissuade investors from choosing low quality ETFs when there are superior options on the market. I believe we are in an economic environment unavoidably poised to experience rising interest rates. Inverse bond ETFs can be used shrewdly to capitalize on this market inevitability. Also, they can be used as hedging tools for bond heavy portfolios. However, there is long list of risks associated with investing in an inverse bond ETF, and it is prudent to research and analyze each security before investing. I believe inverse bond ETFs are valuable resources; however, it is important to know which inverse bond ETFs are the best in order to maximize returns. The Direxion Daily 7-10 Year Treasury Bear ETF (NYSEARCA: TYNS ) is inferior to the Proshares 7-10 Year Treasury ETF (NYSEARCA: TBX ) because it has very little assets under management, extremely low daily volume, and very average spreads. What Makes an Inverse Bond ETF Bad? When evaluating an inverse bond ETF it is important for an investor to look for one that is traded heavily and correlates well to its underlying index. The three most important metrics for determining the quality of an inverse bond ETF are liquidity, expense, and assets under management. A good inverse bond ETF has a low expense ratio, is highly traded, and maintains assets with wide coverage. A bad inverse bond ETF does just the opposite. Another metric that ought to be considered is the strength of the underlying institution that issues the inverse bond ETF. If underlying institution cannot honor the investment, an investor stands to lose everything. Another factor that ought to be considered is the inverse bond ETF’s multiplied leveraged. Inverse Bond ETFs come in three sizes: 1X, 2X and 3X . 2X and 3X ETFs are designed to multiply the daily returns (or the inverse returns) of the performance of an underlying index. 1X ETFs follow the daily returns of its underlying index one for one. Since 3X inverse bond ETFs multiply daily returns by three times, the risks already associated with inverse bond ETFs are exacerbated exponentially. Compounding risk greatly affects returns of 3X ETFs particularly when tracking range bound indexes. TYNS Analysis The Direxion Daily 7-10 Year Treasury Bear ETF provides inverse exposure to a market-value-weighted index of U.S. Treasury bonds with remaining maturities between 7 and 10 years. TYNS provides daily inverse -1X exposure to the NYSE 7-10 Year Bond Index. The index is designed to rise when interest rates rise and bond prices fall. TYNS is a bet on rising yields. With the eventuality of rising rates, TYNS theoretically ought to perform well. TYNS has a net expense ratio of 0.65% which is a management fee that diminishes returns. TYNS only has 1.55 million assets under management which is pathetically outmatched by TBX which has 40.2 million AUM. The lack of AUM essentially renders TYNS useless for investing purposes. Finally, TYNS has daily volume of 1,846 compared to TBX which has daily volume of 9,672. TYNS has tons of liquidity risk, and TYNS has such a low AUM that it is an unreliable investment for all but the smallest investors. TYNS Graph I included a graph of TBX, TYNS, and 10 Year yields to visually show the horrible amounts of daily tracking error inherent with an illiquid ETF like TYNS. TBX clearly tracks daily volatility in 7-10 year yields than TYNS. Conclusion It is painfully obvious that TBX is superior to TYNS in almost every way. The only metric TYNS was better than TBX in was its expense ratio. TBX had an expense ratio of 0.95% compared to TYNS’s 0.65%. However, the higher expense is completely worth it for owning a tradeable, correlated, and liquid inverse bond ETF. Disclosure: I/we have no positions in any stocks mentioned, and no plans to initiate any positions within the next 72 hours. (More…) I wrote this article myself, and it expresses my own opinions. I am not receiving compensation for it (other than from Seeking Alpha). I have no business relationship with any company whose stock is mentioned in this article.

The Drop In How Many U.S. Stocks Equaled 1 Greek Economy?

The article shows that the capitalization change of a small number of large-cap U.S. stocks equaled the entire annual output of the Greek economy. This effort is in part to frame the impact Greek turmoil is having on U.S. assets. A qualitative discussion of whether this capitalization change is warranted is included. The title of this article asks readers to guess the number of U.S. stocks whose reduction in market capitalization on Monday was equivalent to the size of annual Greek economic output. The answer: 86 To come up with the figure, I compared the gross domestic product of the Greek economy from the World Bank to the capitalization change of the largest components of the S&P 500 (NYSEARCA: SPY ) by market capitalization until the change in value equated to the Greek GDP of $242B. I had some notable takeaways from this data that I wanted to share with readers. The question for market participants is whether these moves are justified. If the value of an asset is its future cash flows discounted back to the present, then the reduction in domestic equity prices on Monday was either a function of an expectation of lower future cash flows and/or a higher discount rate. The former, lower future cash flows, seems unlikely to have had a large impact given the limited trade between the U.S. and Greece and the fact that the Greek economy is roughly the size of the Minneapolis-area economy. The negative translation effect of broader global cash flows earned by these U.S. companies from a strengthening U.S. dollar would have had a proportionately larger impact. That means that the re-pricing of risky assets is more likely a function of a higher discount rate. The interest rate component of the discount rate fell on Monday as U.S. rates rallied on a flight-to-quality bid signaling that an “equity risk premium” applied to U.S. equities increased to move the discount rate higher. While the outcomes from a potential “Grexit” remain uncertain and difficult to analyze, the transmission mechanism for broader global contagion seems equally uncertain. The potential financial sector link, which roiled equity markets in 2012 given the amount of Greek debt held by European banks at the time, appears to have been muted by a rotation of Greek debt from bank balance sheets to official creditors, enhanced stability mechanisms, European quantitative easing, and much lower yields in the periphery. While the odds of a disorderly outcome in Europe are certainly rising, investors must handicap how much of a risk premium on global assets is justified. While we are likely to continue to see heightened volatility in the near term, if the Greek drama was responsible for the entirety of the move on these 86 companies, I believe that the impact has been overstated already. Disclaimer : My articles may contain statements and projections that are forward-looking in nature, and therefore inherently subject to numerous risks, uncertainties and assumptions. While my articles focus on generating long-term risk-adjusted returns, investment decisions necessarily involve the risk of loss of principal. Individual investor circumstances vary significantly, and information gleaned from my articles should be applied to your own unique investment situation, objectives, risk tolerance, and investment horizon. Disclosure: I am/we are long SPY. (More…) I wrote this article myself, and it expresses my own opinions. I am not receiving compensation for it (other than from Seeking Alpha). I have no business relationship with any company whose stock is mentioned in this article.

History Says Shorting Volatility Is The Right Move Here

VXX spiked almost 17% on Monday. That is the fourth largest move it has ever had. I believe this represents a unique opportunity to benefit from panicking investors. In the last couple of months of last year and into 2015, I spent a lot of time trading volatility (NYSEARCA: VXX ). I was fortunate enough to have pretty good success but when markets largely calmed down earlier this year, there wasn’t much going on. Well, for anyone that wasn’t under a rock on Monday, volatility returned all at once as the VIX spiked 34% on the day amid worries imported from Greece. I won’t go over the Greece drama because you can read about it many other places so in this article, I’ll focus directly on what I think is a very tradable move in the VIX via the ETF VXX. (click to enlarge) We can see the move in the VXX yesterday was absolutely massive. It gapped up on the open but that was just the start of the action as we can see from the chart. That sets up what I believe is a reasonably high risk, high reward setup in volatility that investors can consider if you believe the Greek crisis will be a ‘sell the news’ kind of event. The VXX moved up nearly 17% on Monday so that got me to thinking; that’s a huge move, how many times has this happened before? I pulled pricing data since VXX’ inception from Yahoo! and looked to see how many daily moves were in excess of Monday’s gain and the answer is just three. Three days in 2011 (two in August, one in November) posted up moves of more than Monday’s 16.8% move. First off, there have been more than 1,600 trading days for VXX so the fact that Monday’s move was larger than all but three days is quite extraordinary in itself. That alone would suggest a bit of value seeking may be in order simply due to the magnitude of the move. However, the three days in 2011 that saw moves this large were in the midst of a global meltdown in stocks. The S&P was getting crushed along with every other major index around the world so shorting the VXX after the first spike in early August would have been a rough trade. Here’s what happened starting with the day of the first 17%+ spike up in VXX back in 2011. VXX almost doubled after the first move up so in today’s terms, we’d be right there at the beginning of this chart if the pattern repeats. Shorting VXX would have produced sizable losses until the end of 2011 when VXX began to normalize. It looks like a blip on this chart but four months of gut-wrenching losses can get the best of anyone. That is why I always reiterate that trading volatility is not for everyone. There are days when you get crushed and you have to take the pain but if that’s not for you, there are plenty of other instruments to trade. The other point I wanted to make with this chart is that even though VXX nearly doubled after a similar spike to what happened on Monday, in time, it returned to its normal, wealth-destroying self. That is what I want to take advantage of and given that Greece is a small sliver of the Eurozone’s economic output, I’m betting that is exactly what is going to happen. I can’t tell you when it will happen but one thing I know with virtual certainty is that VXX will spike and fall as it always does. I don’t know how high it will go before it falls but fall it will and when it does, it will probably fall hard. That has been the pattern and I’m betting it will take place again. I bought some (NASDAQ: XIV ) on Monday as a way to short the VXX in a virtually costless way and to take advantage of when the VXX does roll over and begin to destroy wealth again. If the market is down again on Tuesday I will buy more because there is a very small chance this trade won’t work out in the favor of VXX shorts over the medium term. VXX is a trading vehicle that erodes value over time so holding the inverse creates value over time, on average. You can put the odds more in your favor when you short into intense strength like what we saw on Monday so that is what I have done. Best of luck out there, it should be entertaining. Disclosure: I am/we are long XIV. (More…) I wrote this article myself, and it expresses my own opinions. I am not receiving compensation for it (other than from Seeking Alpha). I have no business relationship with any company whose stock is mentioned in this article.