Tag Archives: undefined

2014 Commodity Exposure: Futures Vs. ETFs

Throughout the year, we track a simple strategy of buying the 12 month out Futures contract against the commodity ETFs that supposedly track those very same futures, to see just how the performance lines up; knowing that ETFs typically are the ones that underperform because of the contract roll. For more on how this looks long term, see our recent deeper look into the United States Oil ETF, LP (NYSEARCA: USO ) . But regardless of whether you’re tracking correctly – the concept of buying and holding commodities, whether it be via futures, or via ETFs via futures – isn’t proving to be all that great anyway, with an average performance of -7%, compared to the ETFs -11% (and -12% and -16% if don’t include Coffee). It was one of the worst years ever for long only commodities, with the PowerShares DB Commodity Index Tracking ETF (NYSEARCA: DBC ) falling -28% {Past performance is not necessarily indicative of future results}. We’re biased, of course; but we think the better way to have commodity exposure in your portfolio is a “Long/Short” Commodity Strategy; which profits from the rise or fall in prices. We’re talking about Managed Futures, which as a whole, had one of its best years since 2008 . {Past performance is not necessarily indicative of future results}. (Disclaimer: Past performance is not necessarily indicative of future results) (Disclaimer: Sugar uses the October contract, Soybeans the November contract.) Long/Short Ag Trader CTA = Barclayhedge Ag Traders Index) Now that you’ve read this, are you Bullish or Bearish on ? Bullish Bearish Sentiment on ( ) Thanks for sharing your thoughts. Why are you ? Submit & View Results Skip to results » Share this article with a colleague

Hedged ETFs Provide Foreign Exposure Sans Currency Risk

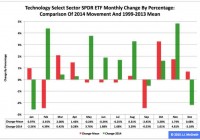
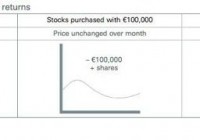
By DailyAlts Staff A new whitepaper from Deutsche Asset & Wealth Management (Deutsche AWM) considers the benefits of using currency-hedged ETFs (exchange-traded funds) to gain foreign equity exposure. Written by Deutsche AWM ETF strategists Dodd Kittsley and Abby Woddham, the paper explores the growth of investor interest in foreign stocks and the ETFs that hold them, as well as considering the potential “currency risk” of holding unhedged foreign equities. Foreign Investment Difficulties Investing in foreign stocks has been difficult historically for a variety of reasons. First and foremost, most foreign stocks trade on foreign exchanges, and domestic investors inherently have reduced access to foreign exchanges. Furthermore, stocks trading on foreign exchanges are priced in foreign currencies, creating an intermediary requirement (and hassle) for U.S. investors to first exchange dollars for foreign currencies, and also creating the phenomenon of “currency risk” – the risk that exchange rates between the dollar and the foreign currency will change during the holding period of the foreign stock. Overcoming Those Difficulties Over time, these difficulties have been addressed one by one. First, the number of foreign stocks trading on U.S. exchanges has increased steadily over time, including Alibaba’s record-breaking IPO last year. Secondly, U.S. investor access to foreign exchange markets has increased – but even more significantly, the rise of ETFs that hold stocks trading on foreign exchanges has greatly expanded investor access to such stocks. Indeed, the low cost, tax efficiency, liquidity, and transparency of ETFs has made them perhaps the most popular means of gaining foreign equity exposure. But for “unhedged” foreign stock ETFs, the phenomenon of currency risk remains – and it can have a devastating impact on an investment’s results. An Example of Currency Risk Deutsche AWM’s whitepaper offers the following example as evidence: Imagine you wanted to buy $150,000 of a stock trading on a German exchange, with the stock’s shares priced in euros. Suppose the exchange rate at the time of the purchase was $1.50 to 1 euro, and therefore $150,000 would buy 100,000 euros worth. Now imagine that a year later, the stock price is flat, and you therefore still have 100,000 euros worth of shares – but unfortunately, the dollar has strengthened against the euro so that $1 equals 1 euro. In this case, your 100,000 euros worth of stock, that you paid $150,000 for a year earlier, would now be worth just $100,000. Due to currency risk, an investment that would have resulted in a breakeven return became a 33% loss. This is illustrated below: (click to enlarge) How Currency Hedging Works In response, ETF providers have developed “currency-hedged” products. These ETFs hold shares of stocks priced in foreign currencies, but they use forward currency contracts to “hedge” against currency risk. This is done by agreeing to sell the foreign currency at the current exchange rate sometime in the future – if, in the example above, you would have agreed to sell 100,000 euros for $150,000 one year in the future at the same moment you bought 100,000 euros worth of stock; then a year later, your stock would still be flat at 100,000 euros, but instead of losing 33% to currency fluctuations, your forward contract would offset that loss with a 33% gain. You could sell your shares for 100,000 euros, but instead of exchanging them for $100,000 at the current exchange rate, your forward contract would entitle you to sell them for $150,000. Conclusion The authors of Deutsche AWM’s paper point out that currency risk is a blade that can cut both ways: Japanese stocks were up 54.6% in 2013 when priced in yen, but only 27.2% when priced in dollars due to the dollar strengthening against the yen that year. But when Japanese stocks only gained 0.6% in 2010 priced in yen, they gained 15.4% that same year priced in dollars due to the yen’s strengthening against the dollar that year. Since exchange-rate changes can have either positive or negative impacts on an investment’s value, the whitepaper’s authors suggest strategically choosing “to hedge or not hedge” based on the outlook for the particular currencies involved. But with the dollar widely expected to strengthen in 2015 as the Federal Reserve begins raising interest rates, currency-hedged ETFs may be particularly worth the consideration of investors seeking exposure to foreign stocks. For more information, download a pdf copy of the whitepaper .

Technology ETF: XLK No. 3 Select Sector SPDR In 2014

Summary The Technology exchange-traded fund finished third by return among the nine Select Sector SPDRs in 2014. As it did so, the ETF was weak at the beginning and the end of the year, while strong in the months in-between. Seasonality analysis of the first quarter is a mixed bag, but my data interpretation suggests a constrained return. The Technology Select Sector SPDR ETF (NYSEARCA: XLK ) in 2014 ranked No. 3 by return among the Select Sector SPDRs that cleave the S&P 500 into nine fragments. On an adjusted closing daily share-price basis, XLK climbed to $41.35 from $35.09, a hike of $6.26, or 17.84 percent. It thus behaved better than its parent proxy, the SPDR S&P 500 Trust ETF (NYSEARCA: SPY ) by 4.38 percentage points, but worse than its sibling, the Utilities Select Sector SPDR ETF (NYSEARCA: XLU ) by -10.90 points. (XLK closed at $41.25 Friday.) XLK ranked No. 7 among the sector SPDRs in the fourth quarter, when it lagged XLU and SPY by -9.00 and -0.72 percentage points, in that order. And XLK ranked No. 9 among the sector SPDRs in December, when it performed worse than XLU and SPY by -5.75 and -1.92 percentage points, respectively. Figure 1: XLK Monthly Change, 2014 Vs. 1999-2013 Mean (click to enlarge) Source: This J.J.’s Risky Business chart is based on analyses of adjusted closing monthly share prices at Yahoo Finance . XLK behaved a lot better in 2014 than it did during its initial 15 full years of existence based on the monthly means calculated by employing data associated with that historical time frame (Figure 1). The same data set shows the average year’s weakest quarter was the third, with an absolutely large negative return, and its strongest quarter was the fourth, with an absolutely large positive return. Inconsistent with this pattern, the ETF had excellent gains each and every quarter last year. Figure 2: XLK Monthly Change, 2014 Versus 1999-2013 Median (click to enlarge) Source: This J.J.’s Risky Business chart is based on analyses of adjusted closing monthly share prices at Yahoo Finance. XLK also performed a lot better in 2014 than it did during its initial 15 full years of existence based on the monthly medians calculated by using data associated with that historical time frame (Figure 2). The same data set shows the average year’s weakest quarter was the second, with a relatively small positive return, and its strongest quarter was the fourth, with an absolutely large positive return. Meanwhile, there is a big difference between the monthly mean and median performances of the ETF in Q1: Personally, I parse the relevant data more bearishly (consistent with the mean) and less bullishly (inconsistent with the median) in the current context. Figure 3: XLK’s Top 10 Holdings and P/E-G Ratios, Jan. 9 (click to enlarge) Note: The XLK holding-weight-by-percentage scale is on the left (green), and the company price/earnings-to-growth ratio scale is on the right (red). Source: This J.J.’s Risky Business chart is based on data at the XLK microsite and FinViz.com (both current as of Jan. 9). XLK appears poorly positioned to be a standout among the Select Sector SPDRs, either this quarter or this year, given factors discussed in “PowerShares QQQ’s 2014 And Fourth-Quarter Performance And Seasonality.” Basically, I anticipate one of the biggest headwinds buffeting the U.S. technology sector in general and XLK in particular over the foreseeable future may be the bias divergence in monetary policy at major central banks around the world. On the one hand, the U.S. Federal Reserve is oriented toward tightening; on the other hand, the Bank of Japan, European Central Bank and People’s Bank of China are oriented toward loosening. This divergence has had important effects on exchange rates, such as in the euro and U.S. dollar currency pair, or EUR/USD. It is worth mentioning in this context that the Fed announced the end of asset purchases under its latest quantitative-easing program, aka QE3+, Oct. 29 and may announce the beginning of interest-rate hikes April 29. Its conclusion of purchases under its first two formal QE programs this century is associated with both a correction and a bear market in large-capitalization equities, as evidenced by SPY’s declines of -17.19 percent in 2010 and -21.69 percent in 2011. The bias divergence at the major central banks has been reflected by action in the EUR/USD cross, which slipped from as high as $1.3992 May 8 to as low as $1.1753 Jan. 8, a slide of -$0.2239, or -16.00 percent, based on data at StockCharts.com. This change in EUR/USD and similar moves in other currency pairs indicate a strengthening greenback and a weakening everything else could pressure earnings of U.S. companies in sectors with substantial international businesses. And XLK encompasses many firms fitting this description, with its exposure to either the tech or the telecommunications sectors at about 100 percent, per its microsite. Meanwhile, the valuations of the ETF’s top 10 holdings seem unlikely to function as tailwinds for it this quarter (Figure 3). Nonetheless, the S&P 500 information-technology sector does not strike me as hideously overvalued, with S&P Senior Index Analyst Howard Silverblatt reporting Dec. 31 its P/E-G ratio was 1.20. Of course, it was a different story with the index’s telecommunications-services sector, with Silverblatt reporting at the same time its P/E-G ratio was 2.16. Disclaimer: The opinions expressed herein by the author do not constitute an investment recommendation, and they are unsuitable for employment in the making of investment decisions. The opinions expressed herein address only certain aspects of potential investment in any securities and cannot substitute for comprehensive investment analysis. The opinions expressed herein are based on an incomplete set of information, illustrative in nature, and limited in scope. In addition, the opinions expressed herein reflect the author’s best judgment as of the date of publication, and they are subject to change without notice.