Tag Archives: transactionname

VNQ: Take The 3.85% Yield; Duplication Is Rarely Worth It

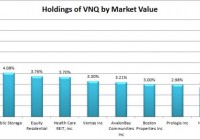
Summary I’ve been getting questions about why investors should choose VNQ over buying largest holdings within VNQ. VNQ offers substantially better diversification than investors can create by replicating the top holdings. The ETF yield is surprisingly similar to the yields across the top holdings. If an investor is committed to a plan of dollar cost averaging, VNQ offers a smart way to minimize trading costs. Vanguard REIT Index ETF (NYSEARCA: VNQ ) offers investors strong distribution yields at a rate of 3.89%. However, some investors are contemplating if they would be better off simply buying the top 5 or 10 holdings of VNQ to avoid the expense ratio and generate more income by concentrating their investments in the REITs with the highest yields. It’s a reasonable idea and it is worth some discussion. I wanted to offer a thorough response on some of the reasons that I believe investing in VNQ is superior to trying to replicate the portfolio through buying the top ten holdings. Holdings I put together a quick chart showing the recent holdings of VNQ based on their most recent market values. (click to enlarge) The top 10 holdings make up about 37% to 38% of the value of the ETF. That is a fairly substantial portion, but not substantial enough that it would make it easy to duplicate the fund by buying the top holdings. An investor that only buys the top 10 would still be missing out on a very substantial amount of diversification from the other 62% or so of the portfolio. Dividend Yields I put together a chart showing the dividend yields on each of the top 10 positions. For the convenience of readers, I kept the holdings in the same order rather than sort them by the highest dividend yields: (click to enlarge) There are certainly a few REITs in this ETF that are paying much higher yields than the main portfolio, but investors focusing on only the highest yield REITs will be putting themselves at risk for slower growth in the pay outs or more risk to the dividend itself. Higher yields are often related to higher levels of risk, so holding only the highest yielding REITs would result in a significantly higher concentration of risk. If you were to take the average yield (equally weighted) of the top 5 REITs, you would have 4.018%. If you take the average yield across the top 10, it is 3.764%. This suggests that all around VNQ is paying a fairly similar level of dividends to what an investor would expect if they focused on buying the top 5 or top 10 holdings by market value in an equally weighted portfolio. Expense ratios are fairly low The Vanguard REIT Index ETF has an expense ratio of only .12%. That does cost shareholders money compared to simply holding all of the underlying securities, but the cost is fairly low compared to the benefits. In exchange for the .12% ratio the investors are able to buy shares in a high liquid ETF with the spread is frequently one cent. On a share price that is floating around $77, that is a very attractive bid ask spread. For comparison, at the time of my checking Simon Property Group, Inc. ( SPG) had a 4 cent bid ask spread on a price around $176 (slightly better larger than VNQ), P ublic Storage (P SA) had a spread of 4 cents on a price around $187, Equity Residential ( EQR) had a spread of 1 cent on shares running around $70 (about equal to VNQ), and Health Care REIT, Inc. ( HCN) had a spread of 2 cents on a price slightly under $70. In short, the Bid-Ask spread on even the largest equity REITs is slightly worse than the spread on VNQ. Granted, if you have an indefinite holding time period the spread is only an issue when purchasing, but it does increase the cost of buying into the position. If an investor has free trading on VNQ (some brokerages do), then their trading cost to buy into positions is limited to crossing the spread. If an investor is simply doing a buy and hold with a 40 year time frame, this isn’t a huge consideration. For the investor with a 40 year time frame that is buying their REITs in one single purchase, it makes sense to replicate the fund. For an investor with a long time frame that intends to continue investing REITs by buying into their position every month or every quarter for dollar cost averaging, it would be better to take advantage of the low spreads and look for a brokerage that is offering no commissions on VNQ. Conclusion While it would be possible to generate higher yields than VNQ by picking the equity REITs with the highest yields, it would also leave an investor facing significantly more diversifiable risk. The extra income may be nice and replicating the portfolio through buying a very large volume of the securities (you’d need more than 10) would make sense for a long term investor that does not plan to be investing new money every month or every quarter. For the investor that is planning to dollar cost average into their investments and builds them up over a period of years, the purchases will be more frequent and the investor may save more on trading commissions and spreads than they lose on the expense ratio. Whether this works or not will depend on the individual investor. My dollar cost averaging strategy puts in place a minimum amount of purchasing activity for REITs, but I will occasionally add to the position when I see share prices fall. Disclosure: The author is long VNQ. (More…) The author wrote this article themselves, and it expresses their own opinions. The author is not receiving compensation for it (other than from Seeking Alpha). The author has no business relationship with any company whose stock is mentioned in this article. Additional disclosure: Information in this article represents the opinion of the analyst. All statements are represented as opinions, rather than facts, and should not be construed as advice to buy or sell a security. Ratings of “outperform” and “underperform” reflect the analyst’s estimation of a divergence between the market value for a security and the price that would be appropriate given the potential for risks and returns relative to other securities. The analyst does not know your particular objectives for returns or constraints upon investing. All investors are encouraged to do their own research before making any investment decision. Information is regularly obtained from Yahoo Finance, Google Finance, and SEC Database. If Yahoo, Google, or the SEC database contained faulty or old information it could be incorporated into my analysis.
Tuttle Tactical ETF Touts Combination Of Capital Gains And Yield

By DailyAlts Staff In today’s low-interest rate environment, coupon payments alone are unlikely to be enough to meet the objectives of yield-hungry investors. Income investors need a combination of yield and capital gains, going forward, and that’s exactly what the Tuttle Tactical Management Multi-Strategy Income ETF (NASDAQ: TUTI ) is designed to provide. In addition to current income, the Tuttle Tactical Management Multi-Strategy Income ETF is designed to provide tactically managed exposure to the markets. Launched jointly by ETF Issuer Solutions and Tuttle Tactical Management on June 10, the former is the ETF’s advisor and the latter is the sub-advisor. Tuttle CEO Matthew Tuttle is the fund’s portfolio manager. “The need for income investing strategies that can allocate tactically in the face of increasingly complex market conditions is clear,” said Mr. Tuttle, in a June 10 press release announcing the new ETF’s launch. “We believe that this ETF is debuting at a critical time for income-minded investors.” The Tuttle Tactical Management Multi-Strategy Income ETF will follow a rules-based investment approach using Tuttle Management’s four uncorrelated tactical models: Income Relative Momentum , which uses monthly relative strength to select one or more income ETPs; Dividend Counter-Trend , which invests in dividend-paying stocks when markets are trending lower intraday, and cash when markets are trending higher intraday; Dividend Tactical Fundamental Earnings , which invests in dividend ETPs when markets are trending higher on weekly models, while earnings are trending downward; and in cash when the reverse is true; and Dividend Absolute Momentum , which invests in dividend ETPs when markets are trending higher on weekly models, and in cash when markets are trending lower, in accordance with their relative strength. These models are based on Tuttle’s investment philosophy, which holds that markets move in recognizable short-term trends and countertrends; but that over the intermediate term, strong asset classes tend to stay strong, while weak asset classes tend to continue in weakness; and over the even-shorter term, markets are dominated by short-term disruptions and other noise. Tuttle’s models attempt to capture gains associated with these outlooks over varying time spans. “The bond market remains challenging for investors, and we know that interest rates will rise,” said Mr. Tuttle. “There is no doubt that the industry appetite for tactical solutions has picked up.” Mr. Tuttle also cited “strong interest” in his firm’s first ETF, the Tuttle Tactical U.S. Core ETF (NASDAQ: TUTT ), which debuted in February. William J. Smalley, President of ETF Issuer Solutions noted that ETF’s success in saying his firm is “very happy to have added TUTI to our listing of featured managers.” The expense ratio for the fund is 1.28%, inclusive of a 0.90% management fee. For more information, download a pdf copy of the fund’s prospectus .

Cheap Stock With A High Yield Or High Yield With A Cheap Stock? How About Both?

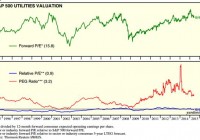
TECO Energy is valued at a substantial discount to its peers based on its forward PEG ratio. TECO Energy offers a current yield of 5.02%. The stigma of its discontinued coal operations along with a dismal dividend growth profile is holding back share prices, but should change with its renewed focus on regulated assets. Are you a value buyer looking for peer undervaluation or are you looking to garner higher income from your invested capital, or a little bit of both? If so, TECO Energy (NYSE: TE ) should be of interest. TE is trading at a comparatively large discount to its anticipated growth rate for the utility sector and the current yield is 5.02%. One measure of fundamental value is the PEG ratio, or price to earnings to earnings growth. Utilities are always on the top of the PEG valuation scale due to slow growth and outsized yields. In most sectors, fair valuation is usually considered at 1.0 for large caps and 1.2 for smaller caps. Over 1.2 is considered overvalued and below 1.0 is undervalued. For utilities, however, it is not uncommon for the PEG ratio to be over 3.0. The PEG ratio for utilities is best used for peer comparisons. One tool that has been used since the early 1970s is the forward PEG ratio, or fundamental valuation based on anticipated 5-yr growth rates and forward earnings estimates. The forward PEG has been one of my personal uppermost due diligence considerations since researching stocks using Value Line in the local library way, way before the internet. The reference librarian got to know me pretty well. However, I digress. Yardeni.com offers an interesting chart of the forward PEG for the utility sector going back 20 years, as represented by the S&P 500 Utility Sector. Below is the chart of the current forward PEG ratio (green line), relative sector P/E to the S&P 500 forward P/E (blue line), and the current forward PEG ratio (red line): (click to enlarge) The current utility sector forward PEG is 3.2 and the average forward P/E is 15.8, reflecting a sector-anticipated growth rate of 4.9%. Enter TECO Energy. The company is going through a transition by selling its coal mining operations to focus solely as a regulated natural gas and electric utility. Its geographic coverage is Tampa Electric (700,000 customers) and Peoples Gas (350,000 customers) in Florida and recently acquired New Mexico Gas (513,000 customers). Earnings per share guidance by management in 2015 is in the $1.08 to $1.10 range, with 2016 consensus estimates of $1.18 to $1.22. Progression in estimates is based on an expansion of its regulated asset base of between 4% and 7%, recent Florida rate case approval with agreed rate increases until 2018, and an allowed ROE in the favorable 10.25% range. TE’s earnings growth rate is offered at between 9.0% and 11.5%, and substantially above the sector average of 4.9%. TECO is trying to sell its coal producing assets in Virginia, Kentucky, and Tennessee. Held as a discontinued asset since third quarter 2014, TECO Coal LLC had a buyer for $80 million in cash and potential future payments of $60 million based on performance targets. However, with the current financial stress of the coal industry, the buyer was unable to acquire the necessary financing and the sale did not close earlier this month. Last week, TE announced a new buyer had stepped in with a 30-day close schedule, but neither terms nor buyers were disclosed. For all intents and purposes, these assets have been written down and the immediate benefit to shareholders from the sale will be a one-time cash inflow of between $0.20 and $0.50 a share. Historically, the coal business has been a large segment of earnings, representing upwards of 30% of net income. As recently as 2011, coal generated over $50 million in income, and coal could be counted on to supply earnings per share of between $0.25 and $0.40 annually. Using the lowest 2016 earnings estimates of $1.13 and the lower project growth rate of 9%, TE’s forward PEG would be 1.7, substantially below the 3.2 of the sector. The current valuation of TE at $17.80 equates to a sector-average forward P/E of 15.7. The undervaluation is based on a much higher growth rate profile. TE’s current yield is 5.02% and represents a substantial income advantage to the sector average 3.5% yield. TE falls in the top tier of utility dividend payers for yield, but offers the disadvantages of a high payout ratio and very low historic dividend growth. While earnings growth is expected to be above average, until the payout ratio declines from around 87% last year to a more comfortable 65% to 70%, investors should not expect dividend growth above a mere nominal level. For example, 3-yr TE dividend growth is 1.3% and 5-yr dividend growth is 1.9%. The best investors should expect over the next three years is inflation-matching dividend growth. However, the current yield of 5.02% should pique the interest of income seekers. Historically, natural gas utilities offer some of the lowest yields in the sector. Using Hennessey Natural Gas Utility Fund (MUTF: GASFX ) and a few of the more popular gas utility stocks as proxies, the representative yield could be between 2.1% and 3.3%. With 50% of customer count from its gas utilities, TE’s yield is comfortably above these averages. Management has generated returns on invested capital in excess of sector average. With peer-average in the 4.5% to 5.0% range, TE’s 5-yr average ROIC is 6.0%, and 3-yr average ROIC is 5.5%. However, their cost of capital is high at 5.7%, according to ThatsWACC.com. TECO could be either an acquirer of smaller utilities, such as its purchase of New Mexico Gas, or as a candidate in the continuing march of utility consolidation. Until the stigma of coal is washed from investors’ memory, TE will trade based on its yield and not its growth prospects. If management delivers on its regulated growth platform, today’s share price and corresponding yield could be looked at as being both cheap and high yield. Author’s Note: Please review disclosure in Author’s profile. Disclosure: The author has no positions in any stocks mentioned, but may initiate a long position in TE over the next 72 hours. (More…) The author wrote this article themselves, and it expresses their own opinions. The author is not receiving compensation for it (other than from Seeking Alpha). The author has no business relationship with any company whose stock is mentioned in this article.