Tag Archives: transactionname

Northland Power – A Renewable Energy Giant In The Making

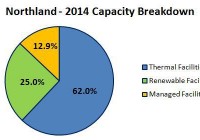
Summary Northland is an independent power producer with a total capacity of 1,356 MW. The company has two giant offshore wind farm projects under construction. These projects should turn the company into one of the world’s biggest renewable energy producers. Currently, Northland shares are undervalued. Northland Power (OTCPK: NPIFF ) is a Canada based independent power producer. As of March 31, 2015, the company owns or has a net economic interest in power producing facilities with a total capacity of approximately 1,356 MW. Northland’s facilities produce electricity from natural gas and renewable resources. Apart from that, the company is developing a few renewable energy projects, which, in a few years, should transform Northland into one of the biggest green companies in the world. In this article I am trying to provide a short description of these projects; in the final section I will try to assess the value of the company’s shares. Capacity As of the end of 2014, the company’s facilities had a total capacity of 1,356 MW, of which the biggest share belonged to thermal facilities (62% of total capacity). The chart below shows the capacity breakdown: source: Simple Digressions and the company’s reports In a few years this situation is going to change. The company has four renewable energy projects under construction (discussed below), which should commence their operations in the next three years. Therefore at the end of 2017, when these projects are finished, the overall company’s capacity should stand at 2,428 MW with renewable energy facilities generating as much as 58.1% of the electricity (chart below). source: Simple Digressions and the company’s reports Northland is turning from thermal generation to renewable energy Looking at the company’s electricity sales it is easily spotted that Northland perceives renewable energy as its main growth driver. Since 2009 the electricity sales generated by thermal facilities have been rising at the rate of 24.7% a year. But in the same time span the electricity sales generated by renewable energy facilities have been rising at much higher rate of 65.8% a year. This trend is going to strengthen in the next three years because all projects under construction are renewable energy ones (wind and solar). Let me discuss these projects in detail. Gemini Gemini is an offshore wind development project located 85 km off the North East coast of the Netherlands. The project will consist of 150 Siemens wind turbine generators, each with a capacity of 4 MW (600 MW in total). Gemini is one the biggest offshore wind projects in the world – the total capital expenditures are expected to be €2.8 billion. Despite these large expenditures, Gemini is an example of a successful non-recourse project financing where expenditures of €2.2 billion will be financed by debt (senior debt of €2.0 billion and subordinated debt of €0.2 billion). The Northland stake in Gemini accounts for 60% – it means that the company’s portion of the equity and junior debt is estimated to be €288 million. The project was awarded up to €4.4 billion of public funding to supplement market revenues from electricity sales. This 15-year award is called SDE Grant and has been issued by the government of the Netherlands. Simply put, the SDE Grant is a contract-for-differences, which supplements market electricity prices traded on the Amsterdam Power Exchange. In order for Gemini to earn the market based component of revenue, a power off-take balancing agreement has been signed with Delta Energy BV, a subsidiary of a Dutch utility company. Currently the financing is closed and Gemini entered its construction phase. The project is expected to be finished in 2017. Northland estimates that Gemini will be producing 2,600 giga-watt hours per year. The company also estimates that the annual EBITDA generated by the project should stand at C$560 – 570 million. Nordsee One Nordsee One, similarly to Gemini, is another offshore wind development project. It is located 40 km north of Juist Island in the North Sea. The project will consist of 54 Senvion wind turbines generators, each with capacity of 6.15 MW (332.1 MW in total). The Nordsee One capital costs are estimated to be €1.2 billion – similarly to Gemini, these expenditures will be financed by non-recourse debt and equity. According to the company’s announcement on the financing close: “Approximately 70% of the project’s required costs will be provided from an EUR840 million non-recourse secured construction and term loan and related loan facilities from ten international commercial lenders. Reflecting the strength of Nordsee One, the financing was oversubscribed. The lending group includes ABN AMRO, Bank of Montreal, Commerzbank, Export Development Canada, Helaba, KfW IPEX, National Bank of Canada, Natixis, Rabobank and The Bank of Tokyo-Mitsubishi” The Northland’s stake in the project accounts for 85%, which means that the company’s portion of equity is estimated to be €288 million. As in the case of Gemini, Nordsee One qualifies for a revenue subsidy. This time it will be a subsidy from the German government granted for 9.6 years (called EEG). It is once again a contract-for-differences, which guarantees a fixed electricity sale price over the subsidy duration. Northland estimates the Nordsee One average annual energy production at 1,200 giga-watt hours; the annual EBITDA generated by the project should stand at C$300 – 310 million. The project is expected to be finished in 2017. Grand Bend Wind Project It is a jointly held (with a 50% stake belonging to the Aamjiwnaang and Bkejwanong First Nations) wind project with a capacity of 100 MW located in Grand Bent, Ontario, Canada. Northland is a developer, construction manager, co-owner and operations manager. The project has a 20-year power purchase agreement with Ontario Power Authority. Project financing is completed and all construction contracts have been signed. The company expects the project to commence operations in spring 2016. The project budget is estimated at C$384 million. Ground-mounted Solar Projects The project consists of 4 individual ground-mounted solar projects with a total capacity of 40 MW. This is a third phase of a partly finished operation, which should be completed in 2015. Northland estimates the project costs to stand at C$329 million, which is around C$83 million higher than previously estimated (this increase is due to legal claims against the former project contractor). The annual EBITDA generated by the project should stand at C$ 22 million. Financial results Since its 2011 conversion from an income trust to a corporation, Northland has been steadily improving its financial results. The company has been increasing its revenue and operating income. On the other hand, due to a very ambitious investment plan realized by Northland, the company’s bottom line looks worse. Finance costs and unrealized losses on derivative contracts are the main contributing factors. For example, in 2014 Northland reported finance costs (interest on debt, borrowings and bank fees) of C$119.9 million. Additionally, Northland reported a loss of C$296.6 million on foreign exchange hedges (these losses were non-cash issues). Therefore, in 2014 the company showed a net loss of C$177.7 million. Now, let me discuss an issue, which is one of the most important metrics in evaluation of any dividend-paying energy company, namely its free cash flow. The chart below evidences free cash flows and dividends paid by the company: (click to enlarge) source: Simple Digressions and the company’s reports As the chart shows, since 2010 Northland has been increasing its dividends. Unfortunately, in the period 2010 – 2012 these increases were not backed by higher free cash flows – the company was over paying its dividends, which was evidenced by the so-called payout ratio, which was higher than 100% (if a payout ratio is higher than 100% a company is paying higher dividend than its free cash flow allows – in the long term such a situation is unsustainable). But since 2013 the company’s dividends have been backed by its free cash flow, with payout ratios of 70 % and 76% in 2014 and 2013 respectively. In the coming years the company expects that its payout ratio will rise over 100% once again. Till 2017 Northland will be involved in construction of two large wind projects (Gemini and Nordsee One). This process demands a lot of money therefore the company, which is determined to sustain its dividends, will have to increase its payout ratio above 100% once again (free cash flow, due to higher investment, will decrease). When both projects are in operation (in 2017) the payout ratio should go well below 100% (due to the increased free cash flow from Gemini and Nordsee One) – please, look at the slide below: (click to enlarge) source: the company’s presentation (page 84) Valuation To estimate value of Northland shares I am using the ratio of EV / EBITDA (enterprise value / earnings before interest, taxes, depreciation and amortization). Because it is quite difficult to find current and reliable EV / EBITDA ratios reported in the renewable energy sector, I am calculating the Northland value using two available ratios: multiple of 9.2 assumed by the Ernst&Young report for base-load independent power producers in the Americas multiple of 14.32 assumed by Aswath Damodaran for Green and Renewable Energy sector In my opinion, the multiple published by professor Damodaran seems to be more appropriate for Northland because this company is currently in a transitory period, which should bring it from a base-load energy producer to a renewable energy company. Another assumption – my calculations are divided into two blocks: Value calculated for current operations Value calculated for two the most important wind projects: Gemini and Nordsee One. Total value is calculated through adding up value of current operations and value of Gemini and Nordsee One. The tables below show the way I have calculated value of Northland: source: Simple Digressions and the company’s reports As the last table shows, I estimate that one share of Northland is worth between $19.9 and $44.6 . Currently the Northland’s shares are trading around C$16 per share, which means undervaluation. Editor’s Note: This article discusses one or more securities that do not trade on a major U.S. exchange. Please be aware of the risks associated with these stocks.
Weapons For Battling Rising Interest Rates

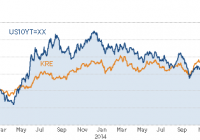
Summary Interest rates will rise eventually. Every investor should have the tools to combat interest rates. Bonds will take a hit, and fixed-income investors should be prepared. Weapons for Battling an Interest Rate Hike An Interest rate hike looms over the U.S. economy. This will have a wide-reaching impact on the financial markets. One potential issue is that bond heavy portfolios may be at risk. I compiled a basket of equities I believe can be utilized to fight and prosper in a climate of rising interest rates. Many of these equities are by no means perfectly correlated, but historically they tend to follow a general, comprehensible trend. Financials First I believe financial groups tend to do well in periods of rising interest rates. Many financial entities achieve higher margins as interest rates rise. Three groups in particular tend to see significant growth . These groups are banks (particularly regional banks), brokers, and insurance companies. Banks (Mainly Regional Banks) Regional banks tend to be less widespread and more reliant on net interest margins than their larger competitors. A larger more diversified bank such as Bank of America will have around 48 percent of its Income Break-up in net interest income. While 48 percent is clearly significant, many regional banks have an average net interest income around 55 percent. Other regional banks have net interest incomes as high as 60-65%. Four such stocks are Comerica (NYSE: CMA ), SunTrust Banks (NYSE: STI ), MB Financial (NASDAQ: MBFI ), and Huntington Bancshares (NASDAQ: HBAN ). A more comprehensive list of regional banks for the inquisitive investor include can be found on the bull sector . Those looking for more coverage might be interested in SPDR S&P Regional Banking ETF, KRE . Due to a prolonged low interest rate environment, many banks are relying on fees and low margins from loans to maintain profitability. Gradually rising rates could certainly benefit regional banks. I made a comparison graph using CNBC to compare the U.S. 10 Year Treasury to KRE: Brokers Often interest rate hikes signal a healthy economy because the Fed believes the economy is in a stable condition to raise rates. A healthy economy will often see increased faith in, and volume of, investment activity. In theory, Charles Schwab (NYSE: SCHW ), E*TRADE Financial (NASDAQ: ETFC ), T. Rowe Price (NASDAQ: TROW ), etc. would receive higher cash flows from increased usage. I used Ishares U.S. Broker-Dealers ETF (NYSEARCA: IAI ) to do a side by side comparison of interest rates and brokerage growth. The ETF is exposed to U.S. investment banks, discount brokerages, and stock exchanges. The two benchmarks are roughly correlated, and brokers have been performing very well in recent years: Insurance Companies While insurance companies certainly have vast and well-diversified portfolios, it seems clear that they are interlinked to low and high interest rates. They are incentivized to hold safe investments with steady cash flows to pay for the insurance policies they write. Their safe investments pay off when interest rates rise and suggest that insurance could see potential growth in the near future. To show this correlation I chose KIE , an insurance ETF. It is not a perfect representation of the insurance market, but it is a good basket of stocks that better represent the market than choosing an individual stock. Individual stocks may be subject to outside forces that could affect the data: The general trend follows interest rates well. Of all the correlations, the insurance ETF is very significant. My personal favorite insurance stocks are Allstate (NYSE: ALL ) and MetLife (NYSE: MET ). Inverse Hedging Tools There are equities that are created specifically to hedge treasury bonds. Since treasury bonds and interest rates are essentially inversely correlated one to one, they can be used extremely effectively. They are ETNs, electronically traded notes, that are leveraged through credit default swaps, and futures to attain (-1x), (-2x), and (-3x) returns. However, any investor should beware that there are serious risk s associated with investing in inverse ETNs. Anyone considering investing in an ETN should weigh the risks beforehand. That being said, there are a few that I recommend. Proshares Short 7-10 Year Treasury ( TBX ) and iPath US Treasury 10-year Bear ETN (NASDAQ: DTYS ) are very good tools for shorting the 10 year bond in particular. There are others such as TBT and TBF for the 20 year. Each one has its risks and rewards, and each is correlated directly to yields. Use with caution. Conclusion For those going to battle against rising interest rates, it is important to have a few weapons in your arsenal. Each weapon is best used for different styles of investing, but it never hurts to have a plan for any situation. I urge everyone to construct a personal plan for combating a potential interest rate hike. Disclosure: The author has no positions in any stocks mentioned, and no plans to initiate any positions within the next 72 hours. (More…) The author wrote this article themselves, and it expresses their own opinions. The author is not receiving compensation for it (other than from Seeking Alpha). The author has no business relationship with any company whose stock is mentioned in this article.

Myths And Reality Of Market Timing (And A Solution)

Summary 4 myths about market timing debunked. Why no usual market timing indicator is reliable. What is a systemic indicator, an example and a solution. Market Timing has two points in common with global warming. The first one is that it lets nobody indifferent. Either you believe it, or you discard it. The second one is that some people have a big interest in convincing the public that it’s a children’s tale. Whatever your opinion, there are harmful myths about market timing. Make sure that your savings don’t become victim of one of them. Myth #1: Timing the market means calling the market tops and bottoms. Reality: Timing the market is detecting when the unpredictable becomes more likely. Those who have knowledge, don’t predict. Those who predict, don’t have knowledge. – Lao-Tzu Market timing is not about making predictions, but telling when the ecosystem is favorable to black swans. Myth #2: Timing the market means improving the return Reality: Timing the market aims at protecting the capital. It’s not how much money you make, but how much money you keep. – Robert Kiyosaki The next table shows the difference between holding permanently SPY and following a timing indicator based on short interest (details on it in this article ) between 01/01/2001 and 05/10/2015.   Annualized return Max Drawdown Volatility (standard deviation) SPY (buy-and-hold) 5.5% -55.4% 19.7% SPY (timed on short interest) 6.3% -20.2% 10.3% The overhead in return doesn’t look great (0.8% annualized), but the risk reduction is impressive, measured in drawdown and volatility. An economic crisis may go from bad to worse if it causes a personal or professional crisis. Millions of people lost their jobs or businesses in the latest recessions. Dipping in savings for a badly needed amount of money is painful at a 20% drawdown, at a 55% drawdown it may wipe out a retirement plan. Even if you believe that the stock market will always recover, market timing reduces the risk of starting again from scratch. Myth #3: Timing the market means finding a good indicator. Reality: No single indicator is good enough to bet your savings on it. Confidence is what you have before you understand the problem – Woody Allen The United States has crossed 22 recessions since 1900 and 49 since 1785. If we consider that data to test usual market timing indicators are available for about a century (in the best cases), the sample is too small to claim that one timing indicator is better than another. Backtests are useful to compare strategies with several hundreds of trades. With so few data points, they are just a complement to common sense in listing possibly relevant variables. Further conclusions and optimized indicators are “fooled by randomness.” Myth #4: Timing the market means selling stocks and going to cash, bonds, gold (delete as appropriate) Reality: Keeping your stocks with a hedge is safer. We will continue to ignore political and economic forecasts, which are an expensive distraction for many investors and businessmen. – Warren Buffett What you think to be safe might not be. Gold price fell with stocks in 2008. Bonds and stocks may also fall simultaneously. It happened 3 times since 1928 on an annual basis: in 1931 (S&P 500 -43.84%, 10-year Treasuries -2.56%), 1941 (S&P 500 -12.77%, 10-year Treasuries -2.02%), 1969 (S&P 500 -8.24%, 10-year Treasuries -5.01%). It happened more often on a quarterly basis (14 times since 1977, the worst in Q3 1981: S&P 500 -10.29%, Barclay’s aggregate bond index -4.07%). A “bipolar” bear market is quite probable in a rising rate environment. The recent MF Global case is a warning that keeping cash in a trading account is not safe either. Customers’ cash has spent 2 years in the limbos, and the outcome may be worse next time a broker files for bankruptcy. With a diversified portfolio based on valuation or dividend, the safest option is likely to continue with the same strategy, unchanged except adding a hedge to put the portfolio in market-neutral mode . Doing so, no assumption is made about inter-market negative correlations. You just bet that your stock picks as a group will float better than the average, and you continue to cash dividends when there are dividends. A note of caution: this is not true if your portfolio is based on momentum. When a market downturn is likely to happen, momentum stocks are dangerous even in a market-neutral portfolio . Solution: a systemic indicator If you spend more than 13 minutes analyzing economic and market forecasts, you’ve wasted 10 minutes – Peter Lynch The first step to a solution is admitting that no determinist or probabilistic model is accurate to explain human group behaviors. Science applied to group psychology looks very much like pseudo-science. It doesn’t mean that scientific knowledge is useless, but we have to relativize it when used in complex systems with empirical purposes. Readers interested in how approaching complexity may have a look at a research field known as Systems Theory initiated many decades ago by the biologist Ludwig von Bertalanffy . Predicting events in particle physics and casino games is complicated yet possible (at least in terms of probabilities), whereas markets are complex. The difference is that the system cannot be explained starting from its parts. Techniques created in another field have at best a limited validity. One of the best attempts (publicly known) of a systemic timing indicator is the US Recession Probabilities by M. Chauvet and J. Piger: Chart from stlouisfed.org (click to enlarge) It looks good for economists, but I see 3 drawbacks in using this index for investing purposes: It uses only 4 economic variables, none of them taking into account the stock market dynamics and valuation. It gives an illusion of continuity. I think that risk states are discrete with sudden gaps. It is updated only once a month. I created and use another one: MTS10 is a composite market-timing indicator aggregating 10 variables in the 4 main categories of market analysis: sentiment, economy, fundamentals, and technicals. It is focused on a long-term investing horizon, based on research and consensus, without curve-fitting (more details here ). The value of MTS10 is an integer between 0 and 10. The value is updated once a week. The alarm level (7 and above) triggers a market-neutral state for my stock strategies. When the value is below 7, the hedge may be proportional to MTS10 or fixed between 0 and 100% depending on the strategy and the risk currently tolerated. The next chart shows MTS10 since 2001 in blue and the S&P 500 index in red. The green lines are the alarm level (horizontal) and the signals when it is crossed. This chart was plotted last week, with MTS10 at 5 (a 6-year high). The value has changed this week. The risk is not necessarily in proportion with the MTS10 value, but obviously, a higher value means a shorter way to the alarm level. The next charts shows a simulation of holding SPY only when MTS10