Tag Archives: transactionname

The Risk Of Owning Stock Assets And Holding Stock Assets Right Now

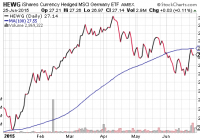
Hold-n-hope advocates believe that greater gains with stocks over investment grade bonds require nothing more than a commitment to accepting increased volatility. At least during the bulk of the current century, one’s willingness to endure wacky stock price changes did not lead to enhanced results. Risk is not synonymous with price volatility, even though erratic price shifts do lead to a greater likelihood of losing money. Hold-n-hope advocates believe that greater gains with stocks over investment grade bonds require nothing more than a commitment to accepting increased volatility. In other words, if you accept the occasional craziness of stock prices, then your rewards will be far more robust than lower yielding debt instruments. But is that even accurate? In the 15-year period through 5/31/2015, stocks exhibited 4 times the amount of price vacillation (a.k.a. volatility) than bonds. Yet the S&P 500 SPDR Trust ETF (NYSEARCA: SPY ) provided annualized gains of 4.5% and the iShares Core Total U.S. Bond Market ETF (NYSEARCA: AGG ) produced annualized returns of 5.4% in the same time frame. At least during the bulk of the current century, one’s willingness to endure wacky stock price changes did not lead to enhanced results. The facts become even more revealing when one examines them in dollar terms. An investor who placed $250,000 in SPY on 6/1/2000 found the investment growing to $483,000 by 5/31/2015. He did not sleep particularly well during the dot-com bust, financial collapse or the euro-zone crisis, but he made progress with his account. Meanwhile, an investor who placed $250,000 in AGG on 6/1/2000 witnessed her investment growing to $550,000 by 5/31/2015. Her world never felt like it was coming to an end; she slept like a beloved house cat on a warm blanket. Risk represents the possibility of loss. Risk is not synonymous with price volatility, even though erratic price shifts do lead to a greater likelihood of losing money. It follows that many trumpet the idea that if you hold stocks long enough, you cannot lose money, let alone lose out to bond assets. Keep in mind, however, there are circumstances when stocks have struggled to break even over 65 years, 30 years as well as 15 years . Additionally, there are no guarantees that one will achieve a positive inflation-adjusted outcome over any time period. On the contrary. History suggests that when one pays an inordinate amount for the privilege of stock ownership, he/she would be fortunate to be “made whole” over 3, 5, 7 and 10 year periods. By nearly every measure of stock valuation, investors are already paying an inordinate amount for stocks. This alone implies that one might be setting himself/herself up for poor returns over the short- and intermediate-term. Let’s revisit the mistake that scores of investors made in June of 2000. They purchased stocks when price-to-earnings (P/E) and price-to-sales (P/S) ratios were higher than they had ever been beforehand. The result? An exceptionally rocky ride that produced little in the way of gain, and that’s if one had the fortitude to hold through thin and thick. Today, the P/E and P/S ratios for the median U.S. stock are higher than they were in June of 2000. So, then, what’s the probable result for buy-n-holders over the next 3, 5, 7 and 10 years? Even 15 years may be discouraging for those who pay today’s premium for ownership privileges. Granted, today’s 10-year yield is 2.38%. In June of 2000? 5.28%. The likelihood that bonds will outperform stocks over the next 15 years may be pretty darn slim. Over 10 years, however? With less risk of loss? Less volatility? In a buy-n-holder’s world, 2.4% on the 10-year may not be so ugly. My approach to the risks associated with owning and holding stocks at the current moment is to maintain cash/cash equivalents at 15%-20% for most of my client base. How did we move from roughly 70% growth/30% income to roughly 55%-60% growth/20%-25% income and a basket with cash/cash equivalents? Throughout the year, I reduced exposure to intermediate- and longer-term bonds; I had reduced the exposure to stock ETFs as well – stock ETFs like iShares Currency Hedged Germany (NYSEARCA: HEWG ) that had hit stop-limit loss orders and/or fallen below key trendlines. I will keep the 55%-60% growth allocation in funds like the Vanguard High Dividend Yield ETF (NYSEARCA: VYM ), the iShares S&P 100 ETF (NYSEARCA: OEF ) and the Health Care Select Sect SPDR ETF (NYSEARCA: XLV ), until those assets break below long-term moving averages or hit pre-determined stop-limit losses. And when cash is raised, the proceeds will be moved to money markets or shorter-term vehicles like the S PDR Nuveen Barclays Short-Term Municipal Bond ETF (NYSEARCA: SHM ). Why the combination of lower-risk equity positions, lower-risk bond positions and a higher cash allocation? Later or sooner, profitability and revenue shortfalls will weigh on equities. Later or sooner, borrowing cost increases will weigh on bonds and stocks. Most importantly, the best way to deal with sky-high valuations as well as the increased cost of capital is to keep more of the dollars that you already have. Is preservation sexy? No. Might it seem like a silly proposition over the next three months, six months, or one year? Perhaps. Looked at another way, though, selling overvalued assets higher offers one the opportunity to purchase fairly valued or undervalued assets lower. With current prospects for stock percentage returns sitting at 0% for three, five, seven and even 10 years, successful investors will prevail by making acquisitions after the proverbial fall. Disclosure: Gary Gordon, MS, CFP is the president of Pacific Park Financial, Inc., a Registered Investment Adviser with the SEC. Gary Gordon, Pacific Park Financial, Inc, and/or its clients may hold positions in the ETFs, mutual funds, and/or any investment asset mentioned above. The commentary does not constitute individualized investment advice. The opinions offered herein are not personalized recommendations to buy, sell or hold securities. At times, issuers of exchange-traded products compensate Pacific Park Financial, Inc. or its subsidiaries for advertising at the ETF Expert web site. ETF Expert content is created independently of any advertising relationships.
Who Ya Gonna Call? VIXbusters Are Here!

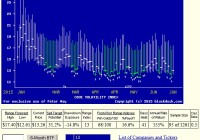
Summary The “fear index” investing/speculating/trading quickly gets submerged into what is for many ordinary investors a morass of arbitrage complexities. So most won’t go near any of the confusing and dangerous ETF products that require constant attention and diddling adjustments. Despite new ETF offerings. Too bad, since assured gains are there from time to time. The trick is in knowing when the time is right to use the tools with adequate market seasoning. Market-makers [MMs] know when. It’s woven into their job. But they are often busy frying much bigger profit fish. Here are simple guidelines for the individual investor to check periodically, any time, any day, for only $25 x 4 a year. The VIXbusters crowd They don’t screw with futures-based ETF products to track and evaluate the VIX INDEX. Contangos, roll yields, backwardation, and margin maintenance are not their things. They deal directly in arbitraging the index itself, hourly or more frequently as necessary, taking the market’s temperature, as preventive maintenance. We check them out at the close, every market day. That tells us what they expect the VIX index can be in the coming near future. Tomorrow, next day, next week. Both upper reaches possible, and lower ones. Sure, you could try to play cute-guy games with untried, unpredictable new ETFs or other more seasoned ones having low credibility and horrible odds of profit success. But there’s no need to take such risks. There are just a few simple things that need to be known. Then the game gets a lot clearer. First, take a look at how the market pros see, and have seen, coming prospects for the VIX Index. Figure 1 (used with permission) The vertical lines of Figure 1 are a visual history of forward-looking expectations of coming prices for the subject ETF. They are NOT a backward-in-time look at actual daily price ranges, but the heavy dot in each range is the ending market quote of the day the forecast was made. What is important in the picture is the balance of upside prospects in comparison to downside concerns. That ratio is expressed in the Range Index [RI], whose number tells what percentage of the whole range lies below the then current price. Today’s Range Index is used to evaluate how well prior forecasts of similar RIs for this ETF have previously worked out. The size of that historic sample is given near the right-hand end of the data line below the picture. The current RI’s size in relation to all available RIs of the past 5 years is indicated in the small blue thumbnail distribution at the bottom of Figure 1. The first items in the data line are current information: The current high and low of the forecast range, and the percent change from the market quote to the top of the range, as a sell target. The Range Index is of the current forecast. Other items of data are all derived from the history of prior forecasts. They stem from applying a T ime- E fficient R isk M anagement D iscipline to hypothetical holdings initiated by the MM forecasts. That discipline requires a next-day closing price cost position be held no longer than 63 market days (3 months) unless first encountered by a market close equal to or above the sell target. The net payoffs are the cumulative average simple percent gains of all such forecast positions, including losses. Days held are average market rather than calendar days held in the sample positions. Drawdown exposure indicates the typical worst-case price experience during those holding periods. Win odds tells what percentage proportion of the sample recovered from the drawdowns to produce a gain. The cred(ibility) ratio compares the sell target prospect with the historic net payoff experiences. Figure 2 provides a longer-time perspective by drawing a once-a week look from the Figure 1 source forecasts, back over (almost) two years. Figure 2 The most important thing to learn from these pictures and this data is that the VIX index is not like most all investable securities. It does not have a growth trend. Its prices do not fluctuate about that trend in any statistical “normal” distribution. MPT and conventional quantitative investment analysis have very little to offer here. VIX Index realities The VIX index is a derivative of other derivatives of the S&P500 index. Our implied price range forecasts from the market-makers are, in turn, a further derivative in a long family chain of such critters. They exist because they have been useful to market pros, far more than to the retail investor or the institutional investor. But like other derivatives, they can’t get used without revealing the expectations of the users. The users operate from a world that is in a narrow balance most of the time, with fluctuations that range in a limited, expected way. For the VIX, its index numbers typically hang around the 15 to 20 level. Their longterm (20-year) average is 20, but is skewed so that 60% are below 20 and 1/3rd are below 15. Its maximum of 80 is so rare that only 1/8th of the time is it above 30. The record low is a hair under 10, and it now is 13, well within, but near the low end of a usual range. The VIX Index goes up when stock prices go down, hence the “fear” label. Here’s the catch But it is very hard to tell in advance when that may happen, by a large enough amount to cause the VIX to rise productively. Past experience from the present MM forecast level has produced (see the row of data under the picture in Figure 1) +16.6% gains on average from the 95 similar forecasts of the last 5 years. But only 68/100 of them were profitable, and they had to recover from typical interim price drawdowns of nearly -15% to do that, or a price swing of over 30%. Not an experience designed to calm the nerves of many retirees. Besides, that “attraction” is largely available only to investment professionals, dealing in more limited circulation markets and securities. In contrast, what the individual investor has had most available is the i Path S&P 500 VIX Short-Term Futures ETN (NYSEARCA: VXX ). It has attracted $1.15 billion of capital and trades 39,164,600 shares a day, sufficient to turn over the entire committed capital in less than 2 days. Not exactly the company of long-term investors, if that is the way you may think of yourself. But such a liquid market might provide some comfort. Let’s see what opportunities the pros have seen there, in comparison to their direct appraisals of the VIX Index in Figures 1 and 2. Figure 3 Figure 4 No, the last 6 months were not an aberration, it is a trend built into the security by its reference to VIX futures instead of the VIX Index as an underlying security. Complex explanations are not needed where pictures make the problem clear. Two other parts of Figures 1 and 3 may also help to enlighten. They are the small blue thumbnail pictures at the bottom of each of those figures that show the distribution of opportunities presented by the forecasts. There are many more, wider opportunities in the VIX distribution than in the narrow, towering cluster of the VXX. VXX provides very little opportunity to anticipate advantageous price change for any but the aggressive day-trader. So how can the individual investor profit from the VIX? The answer is not to try to anticipate a market correction, and thus a rise in the VIX. But instead, to react to one, and profit from the recovery of the market by the VIX’s decline. As is often the case, an ability to do that requires perspective on when to act, using what instrument, and how long to stay committed to a position. The Instrument needed is one that is driven up by a rising market and a declining VIX. There is a related family of such sensitive ETF instruments, led by the P roShares Short VIX Short-Term Futures ETF (NYSEARCA: SVXY ). In support are several leveraged ETFs tracking the S&P500 Index, notably the ProShares UltraPro S&P 500 ETF (NYSEARCA: UPRO ), a 3x ETF tracker, the Direxion Daily S&P 500 Bull 3X Shares ETF (NYSEARCA: SPXL ), and the ProShares Ultra S&P 500 ETF (NYSEARCA: SSO ), a 2X ETF tracker. Figure 5 illustrates SVXY’s appealing price behavior even when markets are only in modest price progress. But Figure 6 should caution that this may not be the time to start or emphasize holdings in SVXY, since we have not yet had the market correction expected by so many VIX advocates. Figure 5 Figure 6 When to act is less of a challenge in anticipating a recovery than in anticipating a correction, but it still is not usually obvious – until after the fact. Conclusion You may do a lot better by calling VIXbusters than VIXbuilders because often market correction worries persist interminably. Time is a valuable resource, made clear by the securities involved here. Our worst recent market correction though, lasted barely 9 months, and until the last couple of them the prevailing focus seemed to be on how much worse it could get. Even missing the first month or two after the turn left another five or so years of upward march, which has pretty much nailed the VIX to its traditional floor. Stay patient. Disclosure: I/we have no positions in any stocks mentioned, and no plans to initiate any positions within the next 72 hours. (More…) I wrote this article myself, and it expresses my own opinions. I am not receiving compensation for it (other than from Seeking Alpha). I have no business relationship with any company whose stock is mentioned in this article.

How To Select Securities

In earlier steps, you should have defined top level asset classes that have a lack of correlation to one another and a timeless strategy. Then, you should have selected underlying sectors that strategically boost returns and take advantage of leading indicators. Lastly, you determined a system to categorize future holdings to implement your investment strategy . The next step is to select specific securities you will purchase to implement this strategy. We call this list of securities our “Buy List,” because it is what we would ideally purchase if a client came to us all in cash. We regularly review our Buy List as we are always looking for even better securities to implement our investment strategy. We use three criteria to judge securities. First, the investment should be diversified within its sector. Diversification is the means of achieving a rebalancing bonus , a boost in returns and decrease in volatility due to moving between low correlation stocks. This bonus is highest when the correlation is lowest, but even correlated assets which often move in sync over the long run experience different volatility and returns over any given year. For this reason, your Buy List investment selections should be as diversified as possible within the targeted sector. Such diversification is not easily achieved with individual company stocks. To use U.S. large cap stocks as an example, you would need over 60 individual stocks to achieve only 86% of the diversification . Diversification via individual stocks is even more difficult for small and mid-cap stocks and impossible to accomplish for foreign stock categories using US stock exchanges. For this reason, your buy list should be funds – exchange traded funds (ETFs) or mutual funds – rather than individual securities. There are two methods of seeing how well diversified a fund is within its category. First, favor funds with a large number of holdings. There is no such thing as “over-diversification.” A fund with 200 small cap value stocks is better diversified than one with only 75. Second, favor funds where the top ten holdings represent a smaller percentage of the fund. A small cap value fund whose top ten holdings represent 75% of the fund is less diversified than one where the top ten holdings only represents 25% of the fund. Second, the expense ratio should be low. The most important selection criterion is expense ratio. Morningstar did a study to see what was a better indicator of a fund having better returns in the future: having a low expense ratio or having more Morningstar stars. They determined that having a low expense ratio was a better indicator than Morningstar stars . Low expense ratios help you earn more when markets go up and lose less when they go down. Over time, this can significantly affect the value of your portfolio. The return of an index fund is simply the return of the index plus or minus tracking error minus fund expenses. This is why having a low expense ratio gives you the best chance of having higher returns. Currently the average asset weighted expense ratio for a stock mutual fund is 0.74%. This cost has been dropping over the past decade as funds have to lower costs in order to compete for market share. In most cases, a good investment advisor can significantly reduce the cost of the funds used to diversify your portfolio. We regularly build portfolios with low expense ratios, and many of the revisions we make to our Buy List are moving towards lower cost funds. Our online gone fishing portfolio has an expense ratio of just 0.32% . Finally, we look for low trading costs. Trading costs, like expense ratios, can hurt returns. While expense ratios hurt fund returns, trading costs hurt the rebalancing bonus by putting a drag on moving in and out of investments. Trading costs are tied to your custodian. For this reason, selection of your custodian is extremely important to your investment philosophy. At Schwab, there are four different types of investments, each with their own type of trading cost. Most stock and ETF trades are made at Schwab’s $8.95 per trade brokerage fee. There are some ETFs on the Schwab platform for which they wave the brokerage fee and allow you to trade them for no cost. This can be deceptive. Some of the no-transaction fee ETFs are Schwab funds with higher expense ratios or larger trading spreads either of which could be more costly than a trading fee. For mutual funds, there is a fee between $25 and $50 depending on how much is being traded and how you have negotiated fees for your clients. Although you should hunt for low trading costs, you should also change your purchasing habits based upon the cost. First, because of compound interest, larger amounts of money can overcome a small trading cost faster than smaller amounts of money. So, if you have a trading cost, assess the how long different initial investments takes to earn back the fee. We do this by measuring the trading cost as a percentage of the purchase amount. If you are purchasing $30,000 of an investment, a $30 trading fee is only 0.1%, which could be earned back in a week. However, if you are only investing $600 in the same investment, the same trading fee would be 5% of your investment, which may take 1 year to earn back. Second, we use a simple technique we call “Rocks and Sand” to keep total expenses low without losing the flexibility of diversifying and rebalancing. Rocks are higher trading cost but lower expense ratio investments. They have a fee when you purchase them as well as a fee when you break them apart but they are cheaper to hold once you have purchased them because of their lower expense ratio. Meanwhile, sand has a lower trading cost but a higher expense ratio. Sand is easy to move from one investment to another but is not ideal for long-term holding. Our transaction fee ETFs or mutual funds are Rocks while no-transaction-fee funds are Sand. We fill each asset class with Rocks. Then when smaller monthly deposits come in, we fill in the asset class with Sand around the Rocks. When a significant amount of Sand collects in an asset class, we sell the sand to purchase a Rock in its place. In this manner, you can identify ideal securities for your Buy List as well as trade them efficiently. Although it is not easily appraised, we believe a curated list of funds is extremely valuable. Our investment committee meets regularly to reevaluate and adjust our Buy List. Even if all you use to select funds is expense ratio, the value might be as high as 0.42%. We can only imagine the value of fund selection also based on strategic fit, diversification, index followed, and trading costs. Your investment strategy is critically important but the implementation requires wise fund selection.