Tag Archives: transactionname

QQQ’s 2015 2nd-Quarter Performance And Seasonality

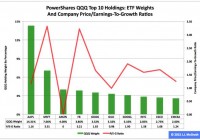
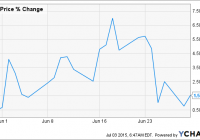
Summary The large-capitalization PowerShares QQQ behaved better in the first half than did the large-cap SPDR S&P 500 ETF. In the second quarter, the adjusted closing daily share price of the derivative of the Nasdaq-100 Index rose by 1.63 percent. In June, the fund’s share price fell by -2.48 percent. PowerShares QQQ’s (NASDAQ: QQQ ) adjusted closing daily share price in 2015’s first half ascended to $107.07 from $103.01, a climb of $4.06, or 3.94 percent. During the period, the ETF behaved better than the SPDR S&P 500 ETF (NYSEARCA: SPY ) by 2.83 percentage points and worse than the SPDR S&P MidCap 400 ETF (NYSEARCA: MDY ) and the iShares Core S&P Small-Cap ETF (NYSEARCA: IJR ) by -14 and -8 basis points, in that order. QQQ last quarter led SPY, IJR and MDY by 1.40, 1.46 and 2.74 percentage points, respectively. And most recently, QQQ last month lagged IJR, MDY and SPY by -3.54 percentage points, 1.21 percentage points and 47 basis points, respectively. Comparisons of changes by percentages in QQQ, SPY, MDY, IJR and the small-cap iShares Russell 2000 ETF (NYSEARCA: IWM ) during the first half, over Q2 and in June can be found in charts published in “SPY’s 2015 2nd-Quarter Performance And Seasonality.” Figure 1: PowerShares QQQ Top 10 Holdings, July 2 (click to enlarge) Notes: 1. The QQQ holding-weight-by-percentage scale is on the left (green), and the company price/earnings-to-growth ratio scale is on the right (red). 2. A meaningful P/E-G ratio is incalculable for the generally unprofitable Amazon.com Inc. ( AMZN ). Source: This J.J.’s Risky Business chart is based on data at Invesco’s PowerShares QQQ microsite and FinViz.com (both current as of July 2). QQQ’s constituent companies in general and its top 10 holdings in particular have a tendency to do big business in both domestic and foreign markets (Figure 1). Their sales’ geographic diversification has been an issue during the past year and will be an issue over the next year primarily because of the bias divergence in monetary policy at large central banks around the world, with the U.S. Federal Reserve oriented toward tightening and all the others oriented toward loosening. This bias divergence has had major effects on multiple financial markets, such as those centered on currencies. It has led to a stronger U.S. dollar on the one hand and a weaker euro, a weaker Japanese yen, a weaker British pound, a weaker Canadian dollar, a weaker Swedish krona and a weaker Swiss franc on the other hand. Accordingly, American products and services can cost more than their foreign-based competitors’ offerings in July 2015 than they did in July 2014. Apple Inc. (NASDAQ: AAPL ) does not compete materially on price, but many of QQQ’s constituent companies do so in their foreign markets. And I suspect the currency issue played a role in the first quarter, when only six of the ETF’s top 10 holdings beat their analysts’ consensus earnings estimates, according to Zacks . Meanwhile, these holdings’ P/E-G ratios indicate they are more dear than cheap, with equity-market participants assigning these firms valuations ranging from the apparently insane, Amazon.com, to the seemingly sane, Gilead Sciences Inc. (NASDAQ: GILD ). Figure 2: QQQ Monthly Change, 2015 Vs. 2000-2014 Mean (click to enlarge) Source: This J.J.’s Risky Business chart is based on analyses of adjusted closing monthly share prices at Yahoo Finance . QQQ performed a lot better in the first half of this year than it did during the comparable periods in its initial 15 full years of existence based on the monthly means calculated by employing data associated with that historical time frame (Figure 2). The same data set shows the average year’s weakest quarter was the third, with a relatively small negative return, and its strongest quarter was the fourth, with an absolutely large positive return. Figure 3: QQQ Monthly Change, 2015 Vs. 2000-2014 Median (click to enlarge) Source: This J.J.’s Risky Business chart is based on analyses of adjusted closing monthly share prices at Yahoo Finance. QQQ performed a lot worse in the first half of this year than it did during the comparable periods in its initial 15 full years of existence based on the monthly means calculated by using data associated with that historical time frame (Figure 2). The same data set shows the average year’s weakest quarter was the first, with a relatively small positive return, and its strongest quarter was the fourth, with an absolutely large positive return. Disclaimer: The opinions expressed herein by the author do not constitute an investment recommendation, and they are unsuitable for employment in the making of investment decisions. The opinions expressed herein address only certain aspects of potential investment in any securities and cannot substitute for comprehensive investment analysis. The opinions expressed herein are based on an incomplete set of information, illustrative in nature, and limited in scope. In addition, the opinions expressed herein reflect the author’s best judgment as of the date of publication, and they are subject to change without notice. Disclosure: I/we have no positions in any stocks mentioned, and no plans to initiate any positions within the next 72 hours. (More…) I wrote this article myself, and it expresses my own opinions. I am not receiving compensation for it (other than from Seeking Alpha). I have no business relationship with any company whose stock is mentioned in this article.

Long The S&P 500 But Feeling A Little Uneasy? PUTX May Be Your Answer

Summary Investors in the broad U.S. equity market feeling uneasy or anticipating a correction may buy put options on the S&P 500 for protection. If the timing is right this “insurance” can be valuable. A better way to provide downside protection while also providing upside potential returns is by selling cash collateralized puts on the S&P 500. Investors in the broad U.S. equity market feeling uneasy or anticipating a correction may buy put options on the S&P 500 for protection. If the timing is right this “insurance” can be valuable. However, more often than not, we see the cost of this insurance, buying these puts, reduces returns. A better way to provide downside protection while also providing upside potential returns is by selling cash collateralized puts on the S&P 500. This is exactly the strategy of the recently launched ALPS Enhanced Put Write Strategy ETF (NYSEMKT: PUTX ). PUTX was spearheaded and developed by Rich Investment Solutions, which is a sub-adviser to the new fund. Kevin Rich, founder and CEO of Rich Investment Solutions, came from Deutsche Bank where he created and launched the commodity and currency-based ETFs: the PowerShares DB Commodity Index Tracking Fund (NYSEARCA: DBC ), the PowerShares DB Agriculture Fund (NYSEARCA: DBA ), the PowerShares DB U.S. Dollar Index Bullish Fund (NYSEARCA: UUP ), and the PowerShares DB U.S. Dollar Index Bearish Fund (NYSEARCA: UDN ), among others. In 2013 ALPS and Rich launched the first put writing ETF called the ALPS U.S. Equity High Volatility Put Write Index Fund (NYSEARCA: HVPW ). For many years CBOE has published two benchmark indices on at-the-money monthly put and call writing: the CBOE S&P 500 Put Write Index (PUT), and the CBOE S&P 500 BuyWrite Index (BXM). There have been ETFs in the market tracking BXM for some time but not on PUT. As PUT has shown historically superior returns compared to BXM, there is recent renewed interest and new products coming to market offering investors access via ETFs. With that in mind, we asked Kevin Rich a few questions about their new fund they just launched with ALPS. Dave Fry: Good to talk with you again Rich, can you please tell us a about PUTX? Kevin Rich: Thanks. PUTX is the first broad based put write strategy ETF. PUTX will sell one month at-the-money put options on the S&P 500 every month, or twelve times a year. It’s designed for investors looking for a defensive investment in the in the S&P 500. Selling monthly, at-the-money puts on the S&P 500 has historically generated 18% – 21% option premium per year. While this premium represents close to the maximum upside return of the PUTX strategy, it represents the possible downside protection over the course of a year in a declining market. Dave Fry: Interesting, so is it tracking the CBOE PUT index, which hypothetically sells puts monthly as I understand? Kevin Rich: No, PUTX is not a passive index tracking fund, so it will not replicate the PUT index or strategy. PUTX will look to sell options on a monthly basis not only on the SPX am settled options that the PUT index uses, but PUTX but will also be able to sell options on the SPX pm settled options or on the American style options on the S&P 500® Trust ETF (NYSEARCA: SPY ). PUTX should be able to pick up additional premium over the benchmark index by expanding the underlying options it uses. Dave Fry: Any other differences between PUTX and the CBOE PUT index? Kevin Rich: Yes, PUTX will not simply go long short term U.S. T-bill like the PUT index; rather PUTX will its cash in short duration investment grade fixed income securities. Further, PUTX will have the ability to bring in additional premium intra-month when we see there is an opportunity to roll some strikes up without taking material additional risk for the fund. Dave Fry: Not to harp on the comparison, but do you expect PUTX to track the CBOE PUT index closely? Kevin Rich: Yes, our expectation is we will have a high correlation and beta to the PUT index, but with the strategy differences described earlier we believe PUTX should be able to generate additional returns over the benchmark. Dave Fry: I would expect to have seen the BXM and PUT indices have identical returns over time but PUT has outperformed. Why do you feel selling puts offers and advantage over selling calls? Theoretically they should be the same, but there are 2 main reasons why PUT has outperformed. First, PUT sells ATM or slightly OTM of the money puts, while BXM sells ATM or slightly OTM calls. OTM puts not only provide some additional downside protection to a declining market (OTM calls by definition do not), they also tend to be priced more richly than OTM calls providing more premium. Second, PUT collateralizes its short put position by investing in TBills, while BXM covers its short call positions by investing in the S&P 500. As a result, PUT performance benefits from interest income while BXM only benefits from dividend income. Dave Fry: I know you have just launched, but who do you expect to use PUTX and where might it fit in a portfolio? Kevin Rich: Initially we would expect RIAs, funds and institutions familiar with the mechanics and benefits of broad based put writing strategies to adopt PUTX. Really any holder of the S&P 500 should consider diversifying into PUTX because of its defensive potential. Others may hold PUTX in their liquid alternative bucket. Advisers in the larger wire house firms will recognize the potential for PUTX to diversify and add returns over their existing buy write investments, so we expect pick up form these firms; some initially, and others over time. Dave Fry is founder and publisher of ETF Digest and has been covering U.S. and global ETFs since 2001. ETF Digest was named one of the most informative ETF websites in the 10th Annual Global ETF Awards. Disclosure: I/we have no positions in any stocks mentioned, and no plans to initiate any positions within the next 72 hours. (More…) I wrote this article myself, and it expresses my own opinions. I am not receiving compensation for it. I have no business relationship with any company whose stock is mentioned in this article.

EWZ: June Review

Summary The iShares MSCI Brazil Capped ETF grew by 1.55% in June. Out of the 15 biggest EWZ holdings, Cielo was the biggest gainer and Vale was the biggest looser. The Petrobras corruption scandal still impacts Brazilian share markets significantly. The iShares MSCI Brazil Capped ETF (NYSEARCA: EWZ ) grew by 1.55% in June. Although the first half of the month was very good and EWZ’s share price was up by 7% at one point, it started to decline in the second half of June, as the Petrobras (NYSE: PBR ) corruption scandal started to weigh on Brazilian share markets again. On June 19, Reuters reported that police arrested top executives of the two biggest Brazilian construction companies. And on June 25, a wave of panic flooded the markets, as a rumor claimed that the former Brazilian president da Silva should be investigated. Although the rumor was denied quickly, the panic reactions have demonstrated that investors are still extremely sensitive to any news related to the corruption scandal that is still far from over. The portfolio of EWZ consists of 68 share titles. The 15 largest holdings represent more than 60% of assets of the fund. The biggest holdings are prefferred shares of Itau Unibanco (NYSE: ITUB ), the biggest Brazilian bank, followed by shares of Ambev (NYSE: ABEV ), a major South American beer and soft drinks producer. Ordinary shares of the second biggest Brazilian bank, Banco Bradesco (NYSE: BBD ), create 7.19% of the portfolio. And the weight of preferred shares of Petrobras is 5.06%. Source: Own processing, using data of iShares.com The chart below shows the June performance of the 15 biggest holdings. The biggest price increase experienced shares of electronic payment solutions company Cielo ( OTCQX:CIOXY ) (9.55%), shares of Banco do Brasil ( OTCPK:BDORY ) (6.77%) and shares of the stock exchange BMF Bovespa (4.36%). On the other hand, June wasn’t good for shares of the energy sector holding company Ultrapar (NYSE: UGP ) (-4.28%) and for diversified mining company Vale (NYSE: VALE ) (-7.04% and -8.78%). (click to enlarge) Source: Own processing, using data of Bloomberg The share price of Cielo grew by 9.55% in June. The growth was fueled by the announcement that Cielo will acquire 30% of Stelo S.A. The transaction should help Cielo, the biggest Brazilian electronic payment solution company, to expand to the electronic wallet segment. Shares of Vale were crushed by weak metals prices. The iron ore price started to grow after it bottomed in early April near the $46/tonne level and it reached $62/tonne in the first decade of June. But it started to decline again and it was at $55/tonne in late June. Copper price declined by 4% and Vale’s investors started to be nervous again. Not only the share price of Petrobras is negatively affected by the corruption scandal. Also the future growth prospects of the company are negatively affected. The company intends to cut its investments by 37% over the next five years. Petrobras plans to invest $130 billion over the 2015-2019 time period, although the original plan was to spend $207 billion. The company needs to reduce its huge debt, but this decision will reduce its growth significantly. (click to enlarge) Source: Own processing, using data of YahooFinance As shown by the chart above, the EWZ share price is strongly correlated with S&P 500 as well as with oil prices represented by The United States Oil ETF (NYSEARCA: USO ). But the strongest and most stable correlation is between EWZ and Petrobras. Although Petrobras represents only 9.03% of EWZ’s portfolio, it is one of the most important Brazilian companies and it has a strong impact on the whole Brazilian economy. Moreover the current corruption scandal leads to an increased political risk and any negative news about Petrobras tends to affect the whole Brazilian share market. The chart shows that EWZ had the highest correlation with Petrobras share price and S&P 500 in June. (click to enlarge) Source: Own processing, using data of YahooFinance The chart above shows volatility of EWZ measured by 10-day moving coefficient of variation. Although the volatility was high in late May and early June, it was relatively low and stable during the second part of the month. Conclusion The EWZ share price increased by 1.55% in June, when most of the early gains evaporated during the last decade, as the corruption scandal started to unnerve investors again. The moving correlation between EWZ and Petrobras was high and stable in late June. On the other hand the correlation between EWZ and S&P 500 was high and declining and correlation between EWZ and USO was high and growing. The development on global share markets, development of oil prices and any news related to the Petrobras corruption scandal will impact the direction of EWZ in July. Moreover the state of the Brazilian economy isn’t good, the GDP is expected to decline by 1-1.2% in 2015. Although EWZ may be an ineresting long term buy, it is quite probable that its share price will decline in the short term. Editor’s Note: This article discusses one or more securities that do not trade on a major U.S. exchange. Please be aware of the risks associated with these stocks. Disclosure: I am/we are long PBR. (More…) I wrote this article myself, and it expresses my own opinions. I am not receiving compensation for it (other than from Seeking Alpha). I have no business relationship with any company whose stock is mentioned in this article.