Tag Archives: stocks

Securities Lending – The Dark Side Of Mutual Funds

A topic that hasn’t been discussed by market observers and regulators for a while is securities lending, but it might be on the agenda again soon. iShares – the exchange-traded fund (ETF) arm of the world’s largest asset manager, BlackRock (NYSE: BLK ) – has announced that the firm will increase its engagement in securities lending and has therefore scrapped its self commitment on the percentage of securities held by the firm that can be lent to third parties. This step is rather surprising, since securities lending by ETFs was one of the main points raised by critics in the past. The reaction of the ETF industry to this announcement was for some ETF promoters to introduce a ban on securities lending, while others such as iShares introduced a maximum percentage of securities that can be lent. From my point of view, this discussion did not go far enough, since securities lending is not done only by ETFs. The vast majority of securities-lending activity is done by actively managed mutual funds, since the overall assets under management are much higher in this market segment. Is securities lending bad for the investor? Don’t get me wrong, securities lending is not bad per se , but one needs to think twice about getting a fund involved in this kind of activity, since it can have negative impacts on the fund’s performance. The first point to take into consideration is that most counterparties that lend securities use them to build short positions. If this works, the fund and therefore the shareholder of the fund will face a loss on the given position, since it is still a long position for the portfolio. This raises the question of whether securities lending is in the best interest of the fund owner/investor, since the loss might have a higher negative impact on the fund’s performance than what the lending fee adds on the positive side. Income from securities lending as a source of return The income from securities lending is the second point one needs to take into consideration, since the fund does not benefit from the full lending fee. Even though the fund and therefore the investor bear the full risk of the default of a borrower, the lending fee is normally shared between the investor and the fund promoter. Securities-lending activities offer a free lunch to fund promoters, since they get return without bearing any risk. This stream of risk-free cash might be one of the reasons iShares has scrapped its restrictions on securities lending. iShares has lowered dramatically the management fees for some of its ETFs on major market indices to compete with Vanguard in Europe. This means the revenue of iShares and therefore the revenue of the asset manager, BlackRock, might have decreased, and they may want to regain profit by increasing their securities-lending activity – one of the easiest ways to achieve this goal. I think it would be much fairer if the fund promoter got a fixed handling fee for its involvement in the securities-lending activities of the fund instead of a large percentage of the overall income generated by these activities. Again, the fund promoter does not bear any risk and should therefore receive only a small part of the income. An investor should carefully read the annual report of the fund, especially where it is stated how much revenue the fund has made from securities lending and how much of this revenue has been paid to the fund promoter. Collateral as an additional source of risk One may argue that the investor bears no risk from securities-lending activities, since normally all transactions are secured by collateral. That is right, and in most cases these transactions are even over-collateralized. But, since the current regulations on which securities can be used as collateral are rather weak, some market participants may use the collateral to offload toxic or illiquid paper from their balance sheet. If a bank wants to reduce risk on its balance sheet, it may borrow some government bonds from a fund and return unrated or other risky assets as collateral to the lender. This may not look like a serious issue for fund shareholders at first sight, since they won’t own this paper as long as the borrower does not default. But if there is a default, it would be questionable whether all the securities within the collateral are liquid and at what price they can be sold to pay the dues. In this case even an over-collateralization might not protect the investor from a loss in the net asset value of the fund. Increased market efficiency-the bright side of securities lending Even though securities lending seems to be a questionable practice from a shareholder’s point of view, it has some positive effects on the markets. One of these positive effects is increased liquidity in the markets, since all transactions done by the lender increase the liquidity in the underlying security and therefore in the overall market. But it is not only liquidity that makes a market efficient. In addition, the different market participants need to have the ability to “bet” against a security, if the valuation seems to be too high. In this regard, securities lending does help increase the efficiency of markets, since short selling has the effect of bringing down the price of a security. The strategy of a short seller is to search for securities that seem to be overvalued and try to bring the price of the security to a lower level, i.e., a price that is closer to the real value of the security. Monitoring securities-lending activities-a call for investors and regulators From my point of view, the idea of securities lending is not bad at all. But to follow this strategy with securities held in a mutual fund, which is owned by long-term retail investors who can’t evaluate the risk of this kind of activity is a bad idea, especially when the revenue from securities lending is shared between the fund promoter and the investor. Again, I don’t think securities lending is necessarily a bad thing, but investors in a fund should know about these activities before they buy the product. Regulators should force fund promoters to disclose in the key investor information document (KIID) whether they are doing securities lending or not and how the revenues are shared. In addition, the regulator should set clear guidelines on the quality of the securities used as collateral, since this could decrease the level of risk for the investor. It would be helpful for the investor if all funds and not only ETFs would disclose on their website the collateral they accept for the securities they lend out. This would help fund selectors and investors make educated decisions on the risk they might have from securities lending within the fund and would lead to more educated decisions in the fund selection process. Even though some promoters may find this level of transparency hard to achieve, investors should claim a need for this information; they own the assets of the fund and the promoter is the fiduciary who should act in the best interests of the investor. On the other hand, it might be possible that regulators should ban all securities-lending activities from retail mutual funds, if fund promoters are not willing to disclose all the information needed by investors to make a proper evaluation of a mutual fund. After the financial crisis of 2008 investors have become very cautious on the use of derivatives, securities lending, and the involved collateral of mutual funds. I could imagine that it might be a competitive advantage for an asset manager to not be employing any of these techniques when the next crisis hits the market. The views expressed are the views of the author, not necessarily those of Thomson Reuters.
Choosing The ‘Best’ REIT CEF

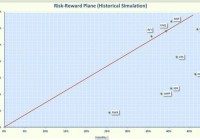
Summary Over the past 8 years, only RNP has consistently outperformed VNQ on a risk-adjusted basis. REIT CEFs help diversify an S&P 500 focused portfolio. Domestic REIT funds outperformed international REIT funds over most of the timeframes analyzed. In November, 2014, I wrote an article expounding the benefits of Real Estate Investment Trusts (REITs). Unfortunately, in late January of this year, REITs hit a speed bump, many dropping by 15% or more. The likely reason was the fear that REIT prices would fall when the Fed raised interest rates. However, since the Fed will likely not raise rates unless the economy is thriving, increased rates may not be all bad for REITs. A robust economy typically bodes well for real estate and according to REIT.com , during the 16 periods since 1995 where interest rates rose significantly, equity REITs generated positive returns in 12 of the periods. As a retiree looking for income, I am a fan of REITs. I own some individual REITs but I tend to gravitate to REIT funds, especially Closed-End Funds (CEFs) because of their high distributions. As prices have decreased, the discounts associated with REIT CEFs have widened and the distribution percentages have increased. If you believe the weakness is temporary, now may be a good time to consider adding REITs to your portfolio. There are currently 12 CEFs focused on REITs, so the question is, which funds are “best.” There are many ways to define “best.” Some investors may use total return as a metric, but as a retiree, risk is as important to me as return. Therefore, I define “best” as the fund that provides the most reward for a given level of risk and I measure risk by the volatility. Please note that I am not advocating that this is the way everyone should define “best”; I am just saying that this is the definition that works for me. This article will analyze the REIT CEFs to assess relative risk-adjusted performance since the bear market of 2008. Along the way, I will also compare the REIT CEFs to Exchange Traded Funds (ETFs). However, before jumping into the analysis, it will be useful to review some of the characteristics of this asset class. In 1960, Congress created a new type of security called REITs that allowed real estate investments to be traded as a stock. The objective of this landmark legislation was to provide a way for small investors to participate in the income from large scale real estate projects. A REIT is a company that specializes in real estate, either through properties or mortgages. There are two major types of REITs: Equity REITs purchase and operate real estate properties. Income usually comes through the collection of rents. About 90% of REITs are equity REITs. Mortgage REITs invest in mortgages or mortgage-backed securities. Income is generated primarily from the interest that is earned on mortgage loans. The risks and rewards associated with mortgage REITs are very different than those associated with equity REITs. This article will only consider equity REITs. One of the reasons REITs are so popular is that they receive special tax treatment, and as a result, are required to distribute at least 90% of their taxable income each year. This usually translates into relatively large yields. But because REITs must pay out 90% of their income, they rely on debt for growth. This means that REITs are sensitive to interest rates. If the interest rates rise, the cost of debt increases and the REITs have less money for business investment. However, as we have discussed, rising rates usually imply increased economic activity, and as the economy expands, there is a higher demand for real estate, which is positive for REITs. To narrow the analysis space, I used the following selection criteria: A history that goes back to 2007 (to see how the fund reacted during the 2008 bear market). Generally, REITs were devastated in 2008, but, like other equities, they have recovered strongly since 2009. A market cap of at least $100M An average daily trading volume of at least 50,000 shares The 7 CEFs that passed the screen are summarized below. Nuveen Real Estate Income ( JRS ). This CEF sells for a discount of 7.6%, which is unusual since over the past 5 years the fund has sold at an average premium of 3.3%. The fund has 93 holdings with 57% invested in REITs and the rest in preferred stock. The REIT’s holdings are spread over all types of properties (retail, office, residential, healthcare, hotels). As with most REITs, the price of the fund dropped over 60% in 2008, but rebounded strongly in 2009, gaining 89%. The fund utilizes 29% leverage and has an expense ratio of 1.8%, including interest payments. This distribution is 9%, funded from income and capital gains, with no return of capital (NYSE: ROC ) over the past year. Neuberger Berman Real Estate Securities Income Fund ( NRO ). This CEF sells for a discount of 16.3%, which is larger than its 5-year average discount of 12.8%. The fund consists of 70 holdings with 66% in diversified REITs and 33% in preferred shares. The price of the fund fell a whopping 78% in 2008, but rebounded over 100% in 2009. The fund uses leverage of 27% and has an expense ratio of 1.7%, including interest payments. The yield is 7.4% funded primarily from income with no ROC. Cohen and Steers Quality Income Realty Fund ( RQI ). This CEF sells for a 13% discount, which is larger than its 5-year average discount of 8.4%. The fund has 126 holdings consisting of REITs (82%) and preferred stock (16%). The price of this fund fell 68% in 2008 and gained 80% in 2009. The fund utilizes 24% leverage and has an expense ratio of 1.9%, including interest payments. The distribution is 8.5%, consisting primarily of income and long-term gains with no ROC. Cohen and Steers Total Return Reality (NYSE: RFI ). This CEF sells for a discount 9%, which is larger than the 5 year average discount of 0.9%. The portfolio consists of 143 securities with 80% in diversified REITs and 19% in preferred stocks. This fund does not use leverage and has an expense ratio of 0.9%. The distribution is 7.7% with no ROC. Cohen and Steers REIT and Preferred Income Fund ( RNP ). This CEF sells for a discount of 15.6%, which is larger than its 5-year average discount of 9.9%. The portfolio consists of 206 holdings with 50% in REITs and 48% in preferred shares. The fund lost 60% in 2008 and rebounded strongly in 2009, gaining over 90%. The fund uses 25% leverage and has an expense ratio of 1.7%, including interest payments. The distribution is 8.3%, consisting primarily of income with about 40% ROC over the past 6 months. The undistributed net investment income (UNII) is positive so I would consider the ROC to be non-destructive. CBRE Clarion Global Real Estate Income ( IGR ). This CEF sells for a discount of 15.1%, which is larger than its 5-year average discount of 9.7%. The portfolio consists of 57 securities with 90% in REITs and the rest in preferred shares. About 50% of the holdings are from the United States with the rest spread over Asia, Europe, Australia, and Canada. The fund dropped 67% in 2008 and gained 79% in 2009. This fund uses only a small amount of leverage (9.6%) and has an expense ratio of 1.1%. The distribution is 7.4%, consisting of income and ROC in roughly equal parts. Some of the distribution appears to be destructive since UNII is negative and is large when compared to the distribution. Alpine Global Premier Properties Fund ( AWP ). This CEF sells for a discount of 13.8%, which is larger than its 5-year average discount of 11.4%. The portfolio consists of 105 holdings with almost all (99%) in REITs. Only 30% of the holdings are domiciled in the United States. The next largest geographical weightings are Japan at 15% followed by the UK at 10% and China at 8%. The fund lost 63% in 2008 and rebounded 79% in 2009. The fund uses only a small amount (2%) of leverage and has an expense ratio of 1.3%, including interest payments. The distribution is 9.2% consisting primarily of income and about 40% ROC. Some of the distribution appears to be destructive since UNII is negative and is large when compared to the distribution. For comparison, I used the following Exchange Traded Funds (ETFs). Vanguard REIT Index ETF ( VNQ ). This ETF was launched in 2004 and tracks the MSCI US REIT Index, which is a pure equity REIT index. The index is diversified across real estate sectors with retail being the largest constituent at 27% followed by Office (15%), residential (15%), and health care (15%). The fund lost a relatively low 37% in 2008 and recovered 30% in 2009. The fund charges a miniscule 0.12%, which is substantially less than most of its competitors. The fund yields 4.1%. SPDR Dow Jones International Real Estate (NYSEARCA: RWX ). This ETF offers exposure to foreign real estate REITs. It holds 120 securities with 54% domiciled in the Pacific region (21% from Japan and 12% from Australia) and 36% domiciled in Europe. This fund lost 50% in 2008 and recovered 36% in 2009. The fund has an expense ratio of 0.59% and yields 3%. For the funds that met my criteria, I plotted the annualized rate of return in excess of the risk-free rate (called Excess Mu on the charts) versus the volatility for each fund. This data is shown in Figure 1. The risk-free rate was assumed to be 1%. The Smartfolio 3 program was used to generate this chart. (click to enlarge) Figure 1. Risk versus reward over bear-bull cycle Figure 1 illustrates that REIT funds have had a large range of returns and volatilities. To better assess the relative performance of these funds, I calculated the Sharpe Ratio. The Sharpe Ratio is a metric, developed by Nobel laureate William Sharpe that measures risk-adjusted performance. It is calculated as the ratio of the excess return over the volatility. This reward-to-risk ratio (assuming that risk is measured by volatility) is a good way to compare peers to assess if higher returns are due to superior investment performance or from taking additional risk. In Figure 1, I plotted a red line that represents the Sharpe Ratio associated with VNQ. If an asset is above the line, it has a higher Sharpe Ratio than VNQ. Conversely, if an asset is below the line, the reward-to-risk is worse than SPY. Some interesting observations are evident from the figure. With the exception of RWX, REIT funds had similar volatilities but significantly different returns. Somewhat surprisingly, RWX was by far the least volatile fund but it also had the least return. RQI and NRO were the most volatile. Over the bear-bull cycle, three funds (RFI, VNQ, and RNP) outperformed the other funds on a risk-adjusted basis with RNP eking out the best performance by a small margin. The international REIT funds (RWX, AWP, and IGR) substantially lagged the domestic REIT funds. RQI had relative good absolute performance but, when coupled with the high volatility, had the fourth best risk-adjusted performance. One of the reasons often touted for owning REITs is the diversification they provide. To be “diversified,” you want to choose assets such that when some assets are down, others are up. In mathematical terms, you want to select assets that are uncorrelated (or at least not highly correlated) with each other. To assess the degree of diversification, I calculated the pair-wise correlations associated with the REIT funds. To round out the analysis, I also included SPDR S&P 500 (NYSEARCA: SPY ) to represent the overall stock market. The results are provided as a correlation matrix in Figure 2. (click to enlarge) Figure 2. Correlation matrix over bear-bull cycle As is apparent from the matrix, REITs did provide a reasonable amount of portfolio diversification. The REIT CEFs were about 70% correlated with SPY. The CEFs were also not highly correlated with each other or with the REIT ETFs (with correlations ranging from 60% to 80%). As you might expect, the Cohen and Steers REIT funds were more correlated with each other than with others funds, but they still offered relatively good diversification. Next, I looked at the past 5-year period to see if the REIT performance had significantly changed. The results are shown in Figure 3. The performances were tightly bunched, but RNP was still the best performer with NRO and RQI both beating VNQ. The international funds improved but still lagged. (click to enlarge) Figure 3. Risk versus reward over past 5 years As a final test, I re-ran the analysis over the past 3 years and the results are shown in Figure 4. What a difference a couple of years made! Over this period, the two ETFs (RWX and VNQ) plus RNP have generated the best risk-adjusted performance. AWP and NRO also had relatively good performance with RQI, RFI, JRS, and IGR lagging. IGR had the worst performance among all the funds. (click to enlarge) Figure 4. Risk versus reward over past 3 years Bottom Line REITs have had good performance in the past but have recently fallen on hard times. If you believe that REITs currently offer a buying opportunity, I recommend either VNQ or RNP, depending on whether you prefer ETFs or CEFs. I would steer clear of international funds since their performance has not be consistent over the years. Disclosure: I/we have no positions in any stocks mentioned, but may initiate a long position in VNQ,RNP over the next 72 hours. (More…) I wrote this article myself, and it expresses my own opinions. I am not receiving compensation for it (other than from Seeking Alpha). I have no business relationship with any company whose stock is mentioned in this article.

Principal To Launch Global Opportunities Equity Hedged Fund

By DailyAlts Staff The Principal Financial Group is actively working to expand its presence in the liquid alternatives arena. On July 9, the firm launched its first ETF, the Principal EDGE Active Income ETF (NYSEARCA: YLD ), which uses a risk-managed approach to invest “opportunistically” across a wide range of income-generating asset classes. This alternative income ETF joined the firm’s alternative mutual fund, the Principal Global Multi-Strategy Fund (MUTF: PMSAX ). And now Principal is planning the launch of a new liquid alternative, the Global Opportunities Equity Hedged Fund, according to a recent SEC filing . Global Opportunities Equity Hedged The Global Opportunities Equity Hedged Fund will seek long-term capital appreciation with lower volatility than the global equity markets. It will pursue these ends by means of investing in U.S. and emerging-market equity securities paired with equity derivatives at the time of purchase. Under normal circumstances, the fund’s holdings will include securities from at least three foreign countries, and foreign securities will constitute at least 30% of its assets. Portfolio managers Christopher Ibach, Xiaoxi Li, and Principal CIO Mustafa Sagun select investments on the basis of value and/or growth potential, and they use a hedging strategy intended to reduce volatility by investing in equity derivatives. Currency forwards may also be used to hedge currency risk. According to the fund’s SEC filing, its net exposure will vary over time, but the fund will always maintain more long equity exposure than it has short exposure through derivatives. Shares of the Global Opportunities Equity Hedged Fund will be available in A-, P-, and institutional-class shares with an investment management fee of 1.10% and respective net-expense ratios of 1.55%, 1.30%, and 1.25%. The minimum initial investment for A-class shares will be $1,000. P- and institutional-class shares have no minimums for qualified investors. Principal’s Other Alternative Fund The Principal EDGE Active Income ETF only launched on July 9, and thus doesn’t have a performance record to speak of. The Principal Global Multi-Strategy Fund, however, debuted back in October 2011, and has earned a three-star rating from Morningstar. For the year ending June 30, 2015, the fund had returns of 2.41%, ranking in the top 29% of all funds in its Morningstar category. For more information, visit principalfunds.com .