Tag Archives: stocks

Adams Diversified Equity: A 6-Month Checkup
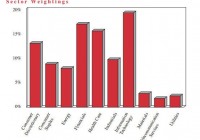
Recently renamed ADX turned in a good first half. Health care and consumer saw new additions. Overall, new management is proving solid so far. Adams Diversified Equity Fund (NYSE: ADX ), formerly known as Adams Express, is one of the oldest closed-end funds, or CEFs, around. That said, a management change in early 2013 meant the potential for big shifts at the fund — and a risk that performance might falter. So far, however, investors should be reasonably pleased with how CEO Mark Stoeckle has been running things. And the first half of 2015 bears that out. Things change… Adams changed its management at the start of 2013, which meant that 2013 was a transition year. Notably, portfolio turnover that year basically doubled compared to historical levels. That said, 2014 saw that number come back down to more-normal levels and that trend has continued so far in 2015. Performance-wise, the fund’s total return in 2013 wasn’t great on a relative basis. Based on net asset value, or NAV, and including reinvested distributions, the fund trailed that S&P by around 3.5 percentage points that year. That said, the fund’s return was 28% in 2013, which is a hard number to complain about. The next year, 2014, wasn’t as good on an absolute basis, but the fund closed the gap with the S&P, with ADX lagging the index by roughly half a percentage point. That’s a much better relative showing. And according to the fund, through the first six months of this year ADX’s return of 2.7% compared favorably to the S&P’s gain of 1.2%. Is this a harbinger of outperformance to come? Maybe, maybe not. As we all know, past returns don’t predict future results. But what it shows is that under new management, ADX hasn’t fallen off a cliff. That said, Stoeckle has only been operating Adams in a generally up market, so he still needs to be tested by a downturn. But investors should be reasonably pleased with the fund’s showing over the last two and half years or so that he’s been running things. New holdings With a fund like ADX, things aren’t usually all that exciting at the portfolio level. This is why the portfolio restructuring in 2013 that doubled the turnover rate was so notable. But with things back to normal, change at the fund is more incremental. For example , Stoeckle noted in the fund’s quarterly report that he added to the fund’s positions in Facebook and Comcast, and added new positions in Valeant and Edwards Lifesciences in health care and Kroger and Spectrum Brands in the consumer space. These aren’t huge shifts or changes, and keep with broader themes already present in the fund. Comcast, around 2.2% of assets at the midpoint of the year, is a top-10 holding, the others are not. That said, while the fund is fairly well diversified, there is one concerning holding — Apple. That stock, the fund’s largest holding, accounted for over 5% of assets at the end of June. That’s a fairly hefty exposure to one company and as the recent Apple sell-off attests, is worth keeping in the back of your mind. Still, at 5% of assets, an Apple sell-off would hurt the fund but alone shouldn’t be enough to cause major damage. The fund sold a number of holding in the period, too. The list includes Abbvie, General Mills, Hershey, Micron Technology, and Unilever. Several positions were trimmed, as well, including Aetna, Coca-Cola, Gilead Sciences, Intel, and Disney. Bouncing those names against the additions, you can see the big picture didn’t alter all that much. Looking at the fund from that greater distance, technology, finance, and health care were the three largest sectors at the end of June, making up roughly half the fund. The consumer sector was number four. Utilities, telecom, and basic materials pulled up the rear, representing the fund’s smallest sector weightings. Dividends and more So the first half was relatively uneventful for the fund. It performed well and aside from Apple, which has long been a large holding, there really weren’t any red flags. Moreover, the portfolio changes were largely shifting within the bigger picture. So mostly good news here. Adams also announced another dividend, of $0.05 a share. That’s relatively small, but keeps with the trend of three small quarterly payments and one larger one at the end of the year. The fund’s goal is to distribute 6% of assets on an annual basis. That’s a number that should interest income-oriented investors. There’s no expected change to that, according to Stoeckle. The way in which distributions are paid out, however, isn’t exactly desirable if you are trying to live off of your investment income. So you’ll have to take that into consideration here if you are buying for the distributions. Note, too, that annual distributions will go up and down based on performance since they are a set as a percentage of NAV, not a hard dollar figure. In addition, the fund bought 765,000 of its own shares in the first half at an average discount of just under 14%. That’s roughly where the discount sits today and in line with its average over the past three years. I’d say that’s a reasonable use of cash and helps to support the fund’s NAV over the long term. Remember, that the fund has been in existence since the Great Depression, so this is far from a fly-by-night operation. And as a stand-alone company, there’s no sponsor manipulating things. What you see is what you get at ADX and it’s looking to stay in business for years to come. So while stock buybacks are interesting, they should be seen in light of a longer-term picture — not necessarily as a way to shift market perceptions today. All of that said, ADX often gets chided for being a closet S&P index clone, which isn’t too far off the mark. However, for investors seeking income, the 6% yield target is much better than the yield on the S&P. True, the expense ratio of 0.65% is high relative to an S&P index, but some investors might be willing to make that trade-off. (Note that actual reported expenses this year will be higher because of one-time items related to the termination of a defined benefit retirement plan, which is likely a net positive for the company and its shareholders.) So, in the end, the first half was a good one for Adams. And while it isn’t a perfect investment, it’s a pretty good one if you are looking to outsource some of your investment load. It’s been around for a long, long time and looks like it will continue to be around for a long, long time to come. Disclosure: I/we have no positions in any stocks mentioned, and no plans to initiate any positions within the next 72 hours. (More…) I wrote this article myself, and it expresses my own opinions. I am not receiving compensation for it (other than from Seeking Alpha). I have no business relationship with any company whose stock is mentioned in this article.
Sector ETFs: Current Market-Maker Expectations For Coming Prices

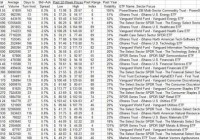
Summary Over two dozen Exchange Traded Funds [ETFs] hold investments focused on broad related industry groups considered to be sectors. Ones intended to track or mimic economic indexes. They provide an easy means of emphasis in a portfolio’s attempt to attain capital growth in excess of that offered by ETFs that track the entire equity market. They present a means of portfolio diversification more concentrated, more precise than groupings by company capital sizes or by artificial, arbitrary accounting “style” definitions of growth or value. Behavioral Analysis of Market-Maker [MM] hedging actions to protect against risks taken in facilitating volume trades for big-$ fund clients reveals coming ETF price expectations. Those forecasts’ qualities are verified by the histories of subsequent market price actions of prior forecasts having similar upside-to-downside expectation proportions. The ETFs being compared here Figure 1 lists the symbols, names, and marketability considerations of the ETFs of interest: Figure 1 (click to enlarge) What may be the customary investor reactions? Some investors are likely to make different preference choices than others in their portfolio emphasis, depending on their time horizons. Long-term speculators (buy&holders) may view the Past Year Volatility and Past Range Index columns as signals of great opportunity in the Energy sector. Whether they would shift capital from Healthcare (high Past Year Volatility and now high Past Year Range Index) into Energy’s low Past Range Index prices is an interesting question. Those who never want to sell anything are likely to hang on to the healthcare gains and hope for recovery in their present badly wounded Energy holdings. The Past Range Index is simply a comparison of that part of the past year’s full price range that is between the current price and the year’s low. A small Past Range Index means the stock is near its year’s low, a large one means the Price Now is near its high. What the investor does with that information may be a “half-full or half-empty” decision: Is a low Past RI a confirmation of continuing trouble, or a big opportunity? Is a big Past RI encouragement for continuation of rewards, or a warning of the potential for loss? Of course, what is needed for an intelligent decision is not a measure of what has already happened, but a measure of what may be coming. Not a past Range Index, but a forecast Range Index. The activist investor’s opportunity/dilemma Making intelligent shifts in a portfolio’s capital assigned to various sectors requires better guidance than can usually be obtained by looking back in time for expectations of what is to come in the future. “Past performance is no guarantee of future results” is the investment lawyer’s security blanket for his employer. True it may be, but that offers little constructive guidance as to what to do about the verity. So, many information venders (and investment managers) take the easy way out. They have observed that if no alternative is readily available, investors will tend to accept the past as the best they have to work from. It’s human nature. And the past information is widely available, cheap and easy to access, and freed from legal liability, so “let ’em play with it.” But it is far from being productive in leading to above average rates of return on equity investments in the future. So, because everyone has it, past checks on its effectiveness as a forecasting means regularly justifies that legal security blanket quoted above. Other human reactions can lead to far more productive thinking, and demonstrate rewarding investment results. One is the natural aversion of humans to being hurt. In the investment game, a universally avoided hurt is loss of capital. Only the brave (speculators) take on the risk of exposure to that kind of hurt. And even then only when they can do it repeatedly under odds that let them exact prices for the service that virtually guarantee them, over a reasonable time, of totally avoiding that possibility of hurt. It’s the Las Vegas casino approach. Or the Investment Bank’s proprietary trading desk approach. Where to find such players on the investing scene? They exist in the Investment Banks, at the Market-Making function. There where big-money investment fund clients repeatedly ask for their help in forcing the gargantuan-sized trades their portfolio sizes require, through the much smaller ordinary transaction windows that serve individual investors adequately most of the time. To get those big trade orders filled usually requires the IB to put some of its firm capital at risk temporarily on the “other side of the trade” from the client. Not as an adversary, but as a transaction facilitator. Back to the hurt-avoidance reaction. The MM protects itself by finding some organization willing to let itself take on the potential price risk the MM wants to avoid. This is a bread-and-butter part of the business that IB prop trading desks thrive on. Their vigorish is ultimately paid by the MM’s client-originator of the trade. Its cost is part of the market liquidity requirement to make desired capital allocation shifts in billion-dollar portfolios. What payments it takes to get the deals done, and the way the hedging deals are structured, tells quite precisely what the participants believe at the time could happen to future prices for the subject securities involved. Contained there are forward-looking forecasts, both of risks and of rewards. Are their forecasts sufficiently accurate to give investing guidance? Here in the discussion it is legitimate to go back to using history, because we have prior examples of forecasts, made in real time of days, weeks, months, and years ago. What happened to prices of the forecast subjects subsequently is a legitimate verification of those implied expectations, not just a projection of past trends. We can look at upside price expectations and see to what extent actual price achievements made them credible. We can compare downside price concerns with worst-case price drawdowns to see what concerns were justified, or perhaps needed to be enlarged. In addition, we can find out what proportion of the forecasts produced winning propositions and infer the odds for success of similar forecasts at present. We can find out what holding periods were required to accomplish targets or to limit risks. Because the forecasting process has been continued daily without change since Y2K, those results may be reasonable reassurances of recurrences. (isn’t alliteration useful?) As long as investors seek to avoid getting hurt, rather than turning masochistic, it ought to be a useful guide. (An aside: Our daily ranking of top-20 stocks and ETFs YTD in 2015 is proving that it is, with 2500+ basis point alphas on over 2,000 closed positions.) All these things are common to any equity investment, making them appropriate dimensions of comparability between all equity investments. That makes unnecessary our rediscovery of the minutia needed by parties to the hedging deal to reach their conclusions. They have done the heavy research lifting for us. What do their forecasts indicate now? Figure 2 is a map of Reward~Risk comparisons between the ETFs in Figure 1. Forecast upside price prospects are on the horizontal green scale at bottom, and actual worst-case price drawdown experiences are measured by the red vertical scale. We use the average worst experiences of prior similar forecasts because they are typically more extreme than the forecast downsides. Figure 2 (used with permission) Looking like the germ that caught penicillin, the SPDR S&P Metals and Mining ETF (NYSEARCA: XME ) at [12], the metals & mining ETF, reflects the volatility of its precious metals holdings more than interests in its base metals. The Vanguard Financials ETF (NYSEARCA: VFH ) at [10] offers the most attractive risk-reward tradeoff, while the Vanguard Information Technology ETF (NYSEARCA: VGT ) at [17] or the Vanguard Utilities ETF (NYSEARCA: VPU ) at [18] has the most price drawdown exposure for the upside payoff being offered. This map contrasts the risk and reward dimensions often most critical to investment selection decisions. But there are other qualitative considerations that enter into good choices of emphasis in portfolio management. They are detailed in Figure 3, along with their parallels of the 2400+ stocks and ETFs in our survey population, the 20 most attractive of that group today, and the MM forecasts for the SPDR S&P 500 Trust ETF (NYSEARCA: SPY ) as a proxy for the most widely-regarded market index. Figure 3 (click to enlarge) These sector ETFs have been ranked by attractiveness on a wealth-building basis. The ranking measure is in column (15) at right. It odds-weights the prospective upside price rewards of (5) with the Win Odds of (8), and the risk exposures of (6) with the complement of (8). Emphasis of frequency of opportunity indicated in the count of prior forecasts (12) having the balance between upside and downside of (7) and conditioned by credibility comparisons of (5) with (9) all enter into the measure. We include all of the factors because different investment objectives and investor preferences may call for alternative importance weightings. Conclusion What may be evident in the blue summary rows at the bottom of the Figure 3 list is that sector investing by across the board use of these 32 ETFs might produce an ultra-conservative portfolio, given current-day prices and MM expectations. The blue-row average payoffs of 2.6% in (9), resulting from prior Forecast Range Indexes (7) like today’s, have been only half of the 5.3% hoped for in (5). That suggests this may not be a wonderfully opportune market environment for fresh broad-brush capital commitments. The next blue row down shows the averages of a ranked selection of the 20 best choices (for wealth-building) equity investments from our large (2475) population of currently available MM price range forecasts. They offer expected +10% gain opportunities that have been more than realized previously. Their win rate of profitable recovery from worst price drawdowns (6) has been of 7 out of every 8 commitments. Average holding periods of 37 calendar days, less than two months, produce annual gain rates of +101%, 6 times the +17% prospect of the average sector ETF in the row above. Differences of this type are not unusual and make passive investing strategies uncompetitive for investors with capital-building objectives constrained by time. Sector ETFs likely to be most favored by wealth-builders today lean to health-care, consumer, financials, and technology orientations. None are outstanding in comparison with the average of the larger population’s best 20, except in the odds of profitable recovery from bad price experiences. But the cost of that advantage in rate of return give-up is quite high. Disclosure: I/we have no positions in any stocks mentioned, and no plans to initiate any positions within the next 72 hours. (More…) I wrote this article myself, and it expresses my own opinions. I am not receiving compensation for it (other than from Seeking Alpha). I have no business relationship with any company whose stock is mentioned in this article.