Tag Archives: spy

5 Ways To Beat The Market: Part II Revisited

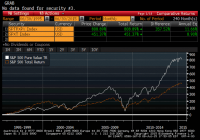
In a series of articles in December 2014, I highlighted five buy-and-hold strategies that have historically outperformed the S&P 500 (SPY). Stock ownership by U.S. households is low and falling even as the barriers to entering the market have been greatly reduced. Investors should understand simple and easy to implement strategies that have been shown to outperform the market over long time intervals. The second of five strategies I will revisit in this series of articles is the “value factor” that has seen stocks with these characteristics outperform the broader market. In a series of articles in December 2014, I demonstrated five buy-and-hold strategies – size, value, low volatility, dividend growth, and equal weighting, that have historically outperformed the S&P 500 (NYSEARCA: SPY ). I covered an update to the size factor published on Wednesday. In that series, I demonstrated that while technological barriers and costs to market access have been falling, the number of households that own stocks in non-retirement accounts has been falling as well. Less that 14% of U.S. households directly own stocks, which is less than half of the amount of households that own dogs or cats , and less than half of the proportion of households that own guns . The percentage of households that directly own stocks is even less than the percentage of households that have Netflix or Hulu . The strategies I discussed in this series are low cost ways of getting broadly diversified domestic equity exposure with factor tilts that have generated long-run structural alpha. I want to keep these investor topics in front of the Seeking Alpha readership, so I will re-visit these principles with a discussion of the first half returns of these strategies in a series of five articles over the next five days. Reprisals of these articles will allow me to continually update the long-run returns of these strategies for the readership. Value In the first article in this series, I described the “size factor”, or why small-cap stocks tend to outperform large-cap stocks over long time intervals. The size factor is captured in the Fama-French Three Factor Model that helped earn Eugene Fama the Nobel Prize in Economics in 2013. Another of these factors is the “value factor.” The researchers noted that low market-to-book stocks tended to outperform high market-book stocks. Adding the “size factor” and value factor” to the Capital Asset Pricing Model better describes the stock market performance than beta alone. Since we are trying to beat the general market, it makes intuitive sense that alpha would be found in a value factor that was used as a supplement to better describe overall returns. Our second way to beat the market, as proxied by the S&P 500, is then to simply buy value stocks. Below I have tabled the average returns of the S&P 500 Pure Value Index, and show the returns of this index graphed against the S&P 500. For more information on this style-concentrated index, please see the linked microsite . This index is replicated through the Guggenheim S&P 500 Pure Value ETF (NYSEARCA: RPV ) with an expense ratio of 0.35%. The S&P 500 Pure Value Index identifies constituents by measures of high levels of book value, earnings, and sales to the share price. In the five strategies I am detailing to “beat the market”, I will be using trailing 20 years of data, which is the longest time interval that encapsulated all of the relevant indices used in the analysis. (click to enlarge) Source: Bloomberg; Standard and Poor’s Source: Bloomberg; Standard and Poor’s Why has value investing worked historically? Why has the S&P 500 Pure Value Index outperformed over this long sample period? Value investing has been extolled since the days of Benjamin Graham, and put into most visible practice by his pupil, Warren Buffett. Value investing necessitates understanding the difference between a stock that is valued too low by the market, and a stock that is a “value trap” because changes in the business or its industry have created a structural headwind. Value investors then need to have the fortitude to hold their investment when investor sentiment runs counter to their investment themes. On average, individual investors do not have these attributes. In data from “How America Saves”, the fund giant Vanguard has published a wealth of data on defined contribution plans under its management. The table below shows participant contributions in Vanguard’s defined contribution plans over the trailing ten years. Investors should on average be taking a long-term view towards their retirement assets; however, investors owned their lowest percentage of equities in 2009 as markets rebounded from the 2008 downturn, missing a 26.5% total return for the S&P 500 and a tremendous 55.2% return for the S&P 500 Pure Value Index. Source: Vanguard – an updated version of their analysis is linked . In the four years that the S&P 500 produced a negative return in our twenty-year dataset, the value index produced a higher return in the following year. In the Vanguard data, retirement plan participants, who should be taking a long-term view towards their investments, were less likely to own equities after 2008. Value investing is a discipline, and the average investor is not suited to follow this approach, which may be why a low-cost, rules-based exchange-traded fund with a value bent like may be a good solution for some investors. While a value-based strategy has historically outperformed, you can see from the data table below that the value-based index lagged in the first half of 2015. Source: Bloomberg, Standard and Poor’s This 249bp first half underperformance relative to the S&P 500 was the last first half underperformance since 2012. In that year, value stocks rebounded by generating a nearly 18% return in the second half versus a 6% return for the broader market. Value stocks have only produced negative returns over the first six months of four calendar years in the dataset, 1994, 2000, 2008, and 2015. Two of those periods (2000 and 2008) preceded economic recessions and one year 1994 – featured sharply higher interest rates. As I wrote in my 10 Themes Shaping Markets in the Back Half of 2015 , with stock prices near all-time highs and bond prices still elevated from low interest rates despite the first half sell-off, forward returns in asset markets will continue to be subnormal. For long-term investors with a buy-and-hold approach, the value factor has generated alpha over long-time intervals. I will be publishing updated results for three additional proven buy-and-hold strategies that can be replicated through low cost indices over the next three days. Disclaimer My articles may contain statements and projections that are forward-looking in nature, and therefore inherently subject to numerous risks, uncertainties and assumptions. While my articles focus on generating long-term risk-adjusted returns, investment decisions necessarily involve the risk of loss of principal. Individual investor circumstances vary significantly, and information gleaned from my articles should be applied to your own unique investment situation, objectives, risk tolerance, and investment horizon. Disclosure: I am/we are long SPY. (More…) I wrote this article myself, and it expresses my own opinions. I am not receiving compensation for it (other than from Seeking Alpha). I have no business relationship with any company whose stock is mentioned in this article.

Long The S&P 500 But Feeling A Little Uneasy? PUTX May Be Your Answer

Summary Investors in the broad U.S. equity market feeling uneasy or anticipating a correction may buy put options on the S&P 500 for protection. If the timing is right this “insurance” can be valuable. A better way to provide downside protection while also providing upside potential returns is by selling cash collateralized puts on the S&P 500. Investors in the broad U.S. equity market feeling uneasy or anticipating a correction may buy put options on the S&P 500 for protection. If the timing is right this “insurance” can be valuable. However, more often than not, we see the cost of this insurance, buying these puts, reduces returns. A better way to provide downside protection while also providing upside potential returns is by selling cash collateralized puts on the S&P 500. This is exactly the strategy of the recently launched ALPS Enhanced Put Write Strategy ETF (NYSEMKT: PUTX ). PUTX was spearheaded and developed by Rich Investment Solutions, which is a sub-adviser to the new fund. Kevin Rich, founder and CEO of Rich Investment Solutions, came from Deutsche Bank where he created and launched the commodity and currency-based ETFs: the PowerShares DB Commodity Index Tracking Fund (NYSEARCA: DBC ), the PowerShares DB Agriculture Fund (NYSEARCA: DBA ), the PowerShares DB U.S. Dollar Index Bullish Fund (NYSEARCA: UUP ), and the PowerShares DB U.S. Dollar Index Bearish Fund (NYSEARCA: UDN ), among others. In 2013 ALPS and Rich launched the first put writing ETF called the ALPS U.S. Equity High Volatility Put Write Index Fund (NYSEARCA: HVPW ). For many years CBOE has published two benchmark indices on at-the-money monthly put and call writing: the CBOE S&P 500 Put Write Index (PUT), and the CBOE S&P 500 BuyWrite Index (BXM). There have been ETFs in the market tracking BXM for some time but not on PUT. As PUT has shown historically superior returns compared to BXM, there is recent renewed interest and new products coming to market offering investors access via ETFs. With that in mind, we asked Kevin Rich a few questions about their new fund they just launched with ALPS. Dave Fry: Good to talk with you again Rich, can you please tell us a about PUTX? Kevin Rich: Thanks. PUTX is the first broad based put write strategy ETF. PUTX will sell one month at-the-money put options on the S&P 500 every month, or twelve times a year. It’s designed for investors looking for a defensive investment in the in the S&P 500. Selling monthly, at-the-money puts on the S&P 500 has historically generated 18% – 21% option premium per year. While this premium represents close to the maximum upside return of the PUTX strategy, it represents the possible downside protection over the course of a year in a declining market. Dave Fry: Interesting, so is it tracking the CBOE PUT index, which hypothetically sells puts monthly as I understand? Kevin Rich: No, PUTX is not a passive index tracking fund, so it will not replicate the PUT index or strategy. PUTX will look to sell options on a monthly basis not only on the SPX am settled options that the PUT index uses, but PUTX but will also be able to sell options on the SPX pm settled options or on the American style options on the S&P 500® Trust ETF (NYSEARCA: SPY ). PUTX should be able to pick up additional premium over the benchmark index by expanding the underlying options it uses. Dave Fry: Any other differences between PUTX and the CBOE PUT index? Kevin Rich: Yes, PUTX will not simply go long short term U.S. T-bill like the PUT index; rather PUTX will its cash in short duration investment grade fixed income securities. Further, PUTX will have the ability to bring in additional premium intra-month when we see there is an opportunity to roll some strikes up without taking material additional risk for the fund. Dave Fry: Not to harp on the comparison, but do you expect PUTX to track the CBOE PUT index closely? Kevin Rich: Yes, our expectation is we will have a high correlation and beta to the PUT index, but with the strategy differences described earlier we believe PUTX should be able to generate additional returns over the benchmark. Dave Fry: I would expect to have seen the BXM and PUT indices have identical returns over time but PUT has outperformed. Why do you feel selling puts offers and advantage over selling calls? Theoretically they should be the same, but there are 2 main reasons why PUT has outperformed. First, PUT sells ATM or slightly OTM of the money puts, while BXM sells ATM or slightly OTM calls. OTM puts not only provide some additional downside protection to a declining market (OTM calls by definition do not), they also tend to be priced more richly than OTM calls providing more premium. Second, PUT collateralizes its short put position by investing in TBills, while BXM covers its short call positions by investing in the S&P 500. As a result, PUT performance benefits from interest income while BXM only benefits from dividend income. Dave Fry: I know you have just launched, but who do you expect to use PUTX and where might it fit in a portfolio? Kevin Rich: Initially we would expect RIAs, funds and institutions familiar with the mechanics and benefits of broad based put writing strategies to adopt PUTX. Really any holder of the S&P 500 should consider diversifying into PUTX because of its defensive potential. Others may hold PUTX in their liquid alternative bucket. Advisers in the larger wire house firms will recognize the potential for PUTX to diversify and add returns over their existing buy write investments, so we expect pick up form these firms; some initially, and others over time. Dave Fry is founder and publisher of ETF Digest and has been covering U.S. and global ETFs since 2001. ETF Digest was named one of the most informative ETF websites in the 10th Annual Global ETF Awards. Disclosure: I/we have no positions in any stocks mentioned, and no plans to initiate any positions within the next 72 hours. (More…) I wrote this article myself, and it expresses my own opinions. I am not receiving compensation for it. I have no business relationship with any company whose stock is mentioned in this article.

Do You Suffer From Investor ADHD?

Many investors are constantly seeking to maximize total return but this is a tactic, not a goal. If your portfolio suffers from being idea constrained, capital constrained, or diversity constrained, you might just have Investor ADHD. Avoid Investor ADHD in order to achieve better results. Do you suffer from Investor ADHD? If you read the news finance pages every day looking for companies in the news as investment ideas, you might just have Investor ADHD. If you constantly seek out a new ticker to invest in, you might just have Investor ADHD. If you buy a stock and then worry simply because it goes down the next day, you might just have Investor ADHD. If you are interested in 4 tickers and can’t decide which one to buy, you might just have Investor ADHD. If you constantly seek to always outperform the S&P500 (or any arbitrary metric stick), you might just have Investor ADHD. If you have more than 50 tickers in your portfolio, you might just have Investor ADHD. There is a lot of information out there in the financial world; staying focused and on plan is not always easy. Those who are able to shut out all the noise, the hustle and bustle, the hype, and the hum of the marketplace chatter will find that they succeed better and with more consistent results than the person who spends 4 hours a day reading and watching the latest financial news and reviewing 100 tickers. Warren Buffett quietly focuses on a simple strategy of finding companies he understands that are selling at a deep discount from their value. Jim Cramer is perhaps the poster boy for Investor ADHD. He is not just a sufferer, he’s a carrier! Don’t get me wrong, I love Cramer. He’s a great entertainer and provides tons of real information on every ticker he comments upon. He just doesn’t stay focused, and his results are scattered (and under perform) as a result. (click to enlarge) (image source: wordpress.com) Managing Investor ADHD: I think most of us have at least some Investor ADHD. We are news and information junkies. If not, we wouldn’t be Seeking Alpha readers. The key to managing Investor ADHD is discipline and planning. It is important not to confuse activity with progress. A plan lays out a goal and the pathway to reach it, along with the criteria to build that pathway. Time Management of Risk Risk is the number one impediment to achieving financial goals. Taking on excessive risk reduces the probability that you will reach your goal and increases the frequency of failure. At the same time, it is also important to realize that a failure to accept adequate risk can also doom a plan to failure. For example, if you need to double your money in 3 years (for some unfathomable reason), then you simply will have to take on large risk. The market place balances risk with returns, accompanying the potential for high rewards with higher risk and greater chance for failure also. Nonetheless, you cannot reach a goal without taking some risk. You can’t collect your prize on the other side of town if you don’t leave the safety of home and venture out upon the roads to get there. The key is to minimize the risk you must take on in order to achieve your end goal. This is why blindly pursuing highest total return is foolish. Highest total return potential requires highest total risk with it. Total return is an impressive metric to look back upon to know what historically has performed well. But it is a one-way filter; it demonstrates those who have reached today in spite of risk or by managing risk the best. It has filtered out those who tried but failed. This is why total return as a goal is far different than total return as a success metric, a subtle but important difference. To illustrate the point better, consider the 10 companies with the best performance of the past 20 years . These are mostly boring companies not seen in the daily news except rarely. Many are Tortoises , a few are rabbits. 1. Kansas City Southern (NYSE: KSU ) 19,030% 2. Middleby (NASDAQ: MIDD ) 14,330% 3. II-VI (NASDAQ: IIVI ) 10,423% 4. EMC Corp. (NYSE: EMC ) 9,624% 5. Qualcomm (NASDAQ: QCOM ) 9,232% 6. Oracle (NYSE: ORCL ) 8,571% 7. Diodes (NASDAQ: DIOD ) 8,601% 8. Biogen Idec (NASDAQ: BIIB ) 6,334% 9. Celgene (NASDAQ: CELG ) 6,244% 10. Astronics (NASDAQ: ATRO ) 6,004% Parts 1 and 2 of my Tortoise series review the historical results of how time is used to manage risk in investing. Statistics show that the longer horizon you remain invested over, the more consistent and reliable your returns will be. For the S&P 500 (NYSEARCA: SPY ), you have a 100% statistical probability of obtaining a 10% average annual rate of return on your S&P 500 portfolio if you remain invested at least 25 years. That falls to 82% chance if you only use a time horizon of 20 years and only a 55% expectation of meeting your 12% annual rate goal if you are invested for 3 years or less. On the other hand, if 8% returns are your goal, then a shorter horizon will get you there with 100% statistical certainty of achieving that goal. You will just need a time horizon of 15 years to be 100% confident of that goal. If you can accept a confidence level of 92% for achieving the 8% goal, a 10-year time horizon will suffice. (source: J.D. Roth, tinyurl.com/5p9fqf ) I strongly urge everyone to read and study J.D. Roth’s wonderful work ” How Much Does The Stock Market Actually Return “. It is a revealing piece on realistic expectations and how time is your most important investing tool if you use a diverse portfolio. Diversity to Manage Risk In addition to time as a risk management tool, diversity of holdings also helps manage risk . Generally speaking, a portfolio with a larger number of individual tickers (directly or via a mutual fund or EFT) will have less volatility and more reliable results than one with narrower holdings. The research, transaction costs, and available opportunities when trying to manage a portfolio of more than 50 individual tickers tends to become overwhelming. If you desire the diversity of more than 50 tickers, then it is probably best to focus on mutual funds and/or ETFs for all or a portion of your holdings. Avoid Being An ADHD Investor: These 8 habits will help you to avoid being an ADHD Investor: 1. First and foremost, set a clearly defined goal. Do you want to have $1 million, $5 million, $x million at the end of your “accumulation phase (generally start of retirement). 2. Consider your time horizon to reach that goal. Shorter time means smaller total returns and more risk. Time is your single greatest tool to manage risk. Start investing early! See part 1 and 2 of my Tortoise series for a discussion and statistics on this subject. seekingalpha.com/instablog/6618191-richa… 3. The second most important way to manage risk is through diversifying. If you do not have enough funds to own at least 20 equal weight tickers, then strongly consider using ETFs to provide diversity and minimize transaction costs. 4. Do not confuse activity for progress . Many investors like to compare their own results against the S&P500. That has some value as a total return metric, but *your* goal may not be total return. It may be capital preservation if you have accumulated or inherited $10 million. It may be safe and reliable dividend income, compound growth, or some other personal need such as “green investing” (oh pleeeeeeze tell me its not green investing!! hehe). 5. Always remember that almost all of us who write for Seeking Alpha are investors ourselves. Read between the lines. Watch out for agendas or pet companies, or a stated or unspoken objective that matches or departs from your own. Watch for what is not said in an reading an idea presentation. Spin can tell you a lot. Sometimes more than the actual information highlighted in a presentation. 6. Listen to and read the company conference calls. These are not just for analysts. They contain the most important information that you as an investor need to know. Keep in mind that “spin-factor” I mentioned in #5 above. Management is going to want to tell you what they want you to know, not what you need to know. For instance; “Results from consumer sales in the Midwest were held back by poor weather conditions which prevailed this past winter” is not just an excuse for low numbers, it is an admission that management is not managing weather risk by hedging for it using commodity or index hedges that are weather sensitive or by balancing with other business segments that benefit for weather that negatively impacts other segments. Thus, a simple phrase like “poor weather conditions” can tell you a lot about management and whether they are sharp enough to control the company’s destiny or at leave themselves (and you, the investor) at the whim of nature and other outside influences. 7. Following up on #6 above, seek out excellent management that has a firm grip on the reigns of destiny and guides the company though all conditions with a firm hand. These are the going to be the true champions for the long journey. 8. Read and embrace analysis that presents both good and bad sides of investments you are considering. No company is perfect. Understanding the strength and the weakness of a company will give you the edge in assessing what to watch for going forward to make it more successful or hold it back. This is true for both internal factors and the macro environment. If you know the 5 key things your company investment is sensitive to and will cause market moves in its shares, then you will know when to buy and when to sell. You will also be able to know in advance when these buy and sell points are nearing based on the gathering portents you will know to watch for. Closing Thoughts: When your brain starts screaming information overload, sit back and focus on a calming influence. Take the time to take a break. For me, I look out my window and see this view… (click to enlarge) (image source: photo by author) Developing and following these habits allowed me to create the opportunity to own my home with this view. Continuing to practice them allows me to enjoy it. I hope you all will create a dream, pursue it, and achieve it. I hope I am able to help you to do that with what I write based on my life experiences along the continuing journey. Richard Become an instant alert follower to be sure to get notice of all my latest analysis and income yield boost articles as they are released. You can follow this link to my other articles , most of which include covered option strategies. If you wish to receive notices of my future articles (or real time alerts as they publish), simply hover your cursor over the “FOLLOW” to the right of my picture at the top of this article or select the options in the author box shown below at the end of this article. I am not a licensed securities dealer or advisor. The views here are solely my own and should not be considered or used for investment advice. As always, individuals should determine the suitability for their own situation and perform their own due diligence before making any investment. Disclosure: The author has no positions in any stocks mentioned, and no plans to initiate any positions within the next 72 hours. (More…) The author wrote this article themselves, and it expresses their own opinions. The author is not receiving compensation for it (other than from Seeking Alpha). The author has no business relationship with any company whose stock is mentioned in this article.