Tag Archives: setpageviewname

The Factor-Based Story Behind Successful Growth Funds

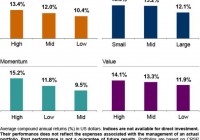
Summary Most large cap stock active fund managers underperformed their benchmarks in the 15 years to December 2014. Active large growth funds performed much better than large value funds vis-à-vis benchmarks. Virtually all of actively managed growth funds’ outperformance can be explained by quantitative multi-factor analysis. Americans have invested trillions of dollars in actively managed mutual funds in the hope of beating an index such as the S&P 500 or the Russell 1000 Growth. At Gerstein Fisher, we believe that markets tend to do a pretty good job of pricing risk and that most investors are better off “buying the market” (via an index fund) than trying to beat it. But we also think that there’s a better way to invest in equities than through either purely passive indexing or traditional active management. I’ll get to that method shortly after sharing summary results of a multi-step fund performance study that we recently conducted. Active Funds and Benchmarks We analyzed two Morningstar categories of funds, large cap growth and large cap value, from January 1, 1990 to December 31, 2014. During this 15-year period, 37% of the growth funds and 42% of the value funds disappeared-liquidated, merged, etc. We studied this aspect to eliminate survivorship bias in the study; obviously, funds that are shuttered by managers tend to be the poor performers. In the next step, we measured how many of the surviving funds outperformed their benchmarks during the 15-year time frame. Of the large cap growth survivors, 67.5% beat their benchmark (Russell 1000 Growth), while just 49% of the living value funds beat their bogey (Russell 1000 Value). All told, 42% of the large cap growth funds that existed in January 1990 beat their benchmark, compared to only 28% of large cap value funds. Moreover, the average outperformance for active growth was 2.14 percentage points per year vs. just 1.17 points for the active value funds. Two conclusions we can draw from this research are that 1) It is very difficult for professional portfolio managers to outperform an index, and 2) Growth appears to be the investing style that quite consistently performs best among actively managed funds. In fact, neither of these conclusions is either particularly new or surprising, as past research by Gerstein Fisher and others has amply demonstrated. See, for example, ” In Mutual Funds, is Active vs. Passive the Right Question? ” Explaining Outperformance But here is where the research gets really interesting. We conducted an extensive statistical analysis of the large cap growth funds that outperformed. We drilled down and studied whether quantifiable company characteristics, or “factors”, could be used to explain the outperformance. We honed in on just four factors– size, value, momentum and profitability-to measure the extent to which excess exposure (relative to the Russell 1000 Growth Index) to these factors could explain outperformance. I’ll digress very briefly to explain the theory and evolution of multi-factor investing. In 1976, Steve Ross published a landmark paper on Arbitrage Pricing Theory, which explained that security returns are best explained by more than one factor.* Since then, academics have identified dozens of quantifiable variables, such as momentum, that impact stock returns. In effect, even stocks from different industries that share similar such characteristics should generate similar returns. The Exhibit below illustrates the premiums over a 40-year period for the four factors we used to analyze the active growth funds. Note, for instance, that investors were historically rewarded with a 3-point premium (per year) for investing in more profitable companies and 3.5 points for being in smaller companies. (click to enlarge) Now back to our study. When we accounted for the momentum, size, value and profitability factors, we found that only 1.6% of the managers actually outperformed the benchmark (after adjusting for positive tilts to these four factors), or generated positive alpha (i.e., excess return of a fund relative to its benchmark). Another way of stating this is that 98.4% of the outperformers had higher factor exposure than the benchmark. For example, 95% of these winners had a positive tilt to value (relative to the Russell 1000 Growth Index) and 64% had higher-than-index exposure to smaller companies. Given this evidence that outperformance of active growth managers is almost entirely explained through their (witting or unwitting) excess exposure to certain factors, the next question is whether there is a rigorous, methodical, quantitative way to target certain factor exposures in order to outperform the index over extended time periods. We believe that there is-the Multi-Factor® quantitative investing style that underpins our three equity mutual funds. In the coming weeks, I plan to write a series of articles to elaborate on the principles and applications of multi-factor investing. In advance of that, I invite you to read a short piece we recently published on this investment strategy: ” What is a Multi-Factor Investment Approach? ” Conclusion Active fund managers have great difficulty beating passive indexes over long time periods. Actively managed growth funds perform well relative to benchmarks compared to value funds, but nearly all of the growth funds’ outperformance can be explained quantitatively by multi-factor analysis. *Finance students will recognize the factor-premium formula for portfolio return–+β11 +β22 +… … + β n n + –where portfolio return is described as the sum of the risk-free rate, factor exposures, and alpha. Disclosure: I/we have no positions in any stocks mentioned, and no plans to initiate any positions within the next 72 hours. (More…) I wrote this article myself, and it expresses my own opinions. I am not receiving compensation for it. I have no business relationship with any company whose stock is mentioned in this article.

Will FedEx’s Q4 Spell More Trouble For Transport ETFs?

The transportation sector has given an ugly performance this year in spite of a strengthening economy, better job conditions and cheap fuel. The major culprit is the strong dollar, which is eroding the profitability of big transporters. The rough trading is expected to continue for the sector in the months ahead, especially after a disappointing fourth quarter 2015 earnings report from bellwether FedEx (NYSE: FDX ). The courier company lagged our estimates on revenues and earnings and guided lower, dampening investors’ mood. However, the numbers were better than the year-ago quarters. Q4 FedEx Results in Detail Earnings per share climbed 4.7% year over year to $2.66 but missed the Zacks Consensus Estimate by four cents. Revenues rose 2.5% year over year to $12.1 billion but fell shy of our estimate of $12.39 billion owing to negative currency translation and lower fuel surcharges. FedEx’s ongoing three-year cost cutting measures in the FedEx Express unit, which started in late 2012, are largely paying off and are expected to continue doing so in the coming quarters. This profit-improvement plan will continue to boost revenue and profitability. However, a strong dollar and lower fuel surcharges will likely keep on hurting the company’s profitability in fiscal 2016. As a result, the second largest U.S. package delivery company provided fiscal 2016 earnings per share guidance of $10.60-$11.10, the midpoint of which is below the Zacks Consensus Estimate of $10.90. Investors should note that FedEx is in the process of acquiring the Dutch parcel-delivery company TNT Express ( OTCPK:TNTEY ) for €4.4 billion ($4.8 billion). The buyout is expected to close in the first half of calendar year 2016. The acquisition, pending European regulatory approvals, would bolster its global footprint, particularly in the European markets with many untapped nations like the UK and France. The deal would create the third-largest delivery company in Europe after United Parcel Service (NYSE: UPS ) and Deutsche Post ( OTCPK:DPSGY ). Hence, the transaction will give a big boost to the company’s competitive position and future growth story. That being said, FedEX has a solid Growth Style Score of ‘A’ with some flavor of value as it also has a Value Style Score of ‘B’. Further, the stock has a favorable Zacks Rank #3 (Hold) and a solid industry Rank in the top 43% at the time of writing. Market Impact FDX shares dropped as much as 3.3% in yesterday’s trading session following disappointing results on elevated volumes of nearly 2.5 times than the average. This represents the biggest one-day fall so far this year. Given this, many investors may want to tap the beaten down price of FDX by considering either of the following ETFs: iShares Transportation Average ETF (NYSEARCA: IYT ) The ETF tracks the Dow Jones Transportation Average Index, giving investors exposure to the small basket of 20 securities. Out of these, FedEx occupies the top position in the basket with 13.5% of assets. Within the transportation sector, railroad takes the top spot with 46.8% share in the basket while air freight and logistics (30.1%), and airlines (15.2%) round off the top three. The fund has accumulated nearly $870 million in AUM while it sees good trading volume of around 438,000 shares a day. It charges 43 bps in fees per year from investors and lost 0.3% on the day following the earnings results. The product is down 8.3% in the year-to-date time frame and has a Zacks ETF Rank of 3 or ‘Hold’ rating with a High risk outlook. SPDR S&P Transportation ETF (NYSEARCA: XTN ) This fund follows the S&P Transportation Select Industry Index and uses almost an equal weight methodology for each security. Holding 50 stocks with AUM of $399.2 million, FedEx takes the fourth spot with a 2.7% share in the basket. The product is heavily exposed to trucking which accounts for 36.2% of total assets while airlines make up for another one-fourth share. Airfreight & logistics, and railroads account for 22.7% and 11% share, respectively. The fund charges 35 bps in fees per year from investors and trades in a moderate volume of about 83,000 shares a day. XTN was down 0.6% at the close after FedEx earnings were released and 8.5% so far in the year. The fund has a Zacks ETF Rank of 1 or ‘Strong Buy’ rating with a High risk outlook. Original Post

Oracle Q4 Disappoints: 3 Tech ETFs To Watch

Tech bellwether Oracle (NYSE: ORCL ) reported lackluster fourth-quarter fiscal 2015 results (ending in May) after the closing bell on Wednesday. The company missed the Zacks Consensus Estimate for earnings and revenues due to negative currency translations and sagging traditional software sales. Oracle Q4 Earnings in Focus Earnings per share came in at 74 cents, lagging the Zacks Consensus Estimate by 8 cents. Revenues declined 5% year over year at $10.7 billion and were well below our $10.95 billion estimate. While the company’s shift to the Web-based cloud computing business is paying off, the gains are unlikely to make up for the declines in the software business. Additionally, a strong dollar remain as a headwind to the company’s performance. Excluding the impact of unfavorable currency rates, revenues would have risen 3%. Cloud software platform sales climbed 29% from the year-ago quarter and accounted for 4% of total revenue. Oracle will continue to benefit from the new generation of cloud computing and Big Data and steal market share from Salesforce.com Inc. (NYSE: CRM ), the only major software company competing in the cloud segment. For the fiscal first quarter, the world’s largest database software maker expects revenues to grow in 5-8% range in constant currency and earnings per share between 56 cents and 90 cents. The midpoint of the earnings guidance is well above the Zacks Consensus Estimate of 58 cents. Based on earnings and revenue miss, Oracle shares tumbled as much as 7.1% in after-hours trading. The sluggish trading is expected to continue in the days ahead given that the stock has a Zacks Rank #4 (Sell) and a poor Zacks Industry Rank in the bottom 34% at the time of writing. ETFs in Focus Given this, ETFs with the highest allocation to this software giant will be in focus in the days ahead. Investors should closely monitor the movement in these funds and avoid these if the stock drags them down: iShares S&P North American Technology-Software Index Fund (NYSEARCA: IGV ) This ETF provides exposure to the software segment of the broader U.S. technology space by tracking the S&P North American Technology-Software Index. The fund holds a basket of 57 securities with Oracle taking the third spot at 8.47% of total assets. It is quite popular with AUM of over $1.2 billion while volume is moderate as it exchanges nearly 99,000 shares a day. The product charges 47 bps in annual fees and has gained about 10.4% so far this year. IGV has a Zacks ETF Rank of 3 or ‘Hold’ rating with a High risk outlook. First Trust NASDAQ Technology Dividend Index Fund (NASDAQ: TDIV ) This fund provides exposure to the dividend payers within the technology sector by tracking the Nasdaq Technology Dividend Index. The product has amassed about $692.7 million in its asset base while trades in volume of around 171,000 shares per day. The ETF charges 50 bps in annual fees. In total, the fund holds about 110 securities in its basket. Of these firms, ORCL takes the sixth position, making up roughly 4.3% of the assets. In terms of industrial exposure, the fund allocates one-fifth portion in semiconductor and semiconductor equipment, followed by technology hardware, storage & peripherals (16.6%) and software (16.5%). The fund is relatively flat so far this year. iShares Dow Jones U.S. Technology ETF (NYSEARCA: IYW ) This ETF tracks the Dow Jones US Technology Index, giving investors exposure to the broad technology space. The fund holds 139 stocks in its basket with AUM of $3.1 billion while charging 43 bps in fees and expenses. Volume is moderate as it exchanges nearly 531,000 shares in hand a day. Oracle takes the ninth spot in the basket with nearly 4% of assets. The product is heavily skewed toward the software and services segments, as these make up for just less than half of the portfolio. Tech hardware and equipment, and semiconductors and semiconductor equipment take the remaining portion in the basket. The fund has added nearly 4% in the year-to-date time frame and has a Zacks ETF Rank of 1 or ‘Strong Buy’ rating with a Medium risk outlook. Original Post