Tag Archives: setpageviewname

EWM: Does This Former Tiger Economy Merit A Closer Look?

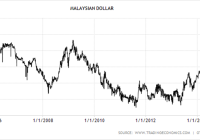
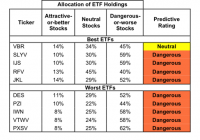
Summary Malaysia has steadily weaned itself off oil revenues and reduced the budget deficit by introducing new taxes and reducing subsidies. Despite high growth, 2.3% inflation and strong foreign currency reserves, the Malaysian dollar has weakened and is close to global financial-crisis lows. Expensive valuations, meager earnings growth and political instability do not provide many incentives to invest in EWM. With a GDP per capita of $12,127, Malaysia is the richest nation state in Southeast Asia. Many investors have avoided Malaysia due to political uncertainties and an over reliance on oil for government revenues. On March 2014, the judiciary found the opposition leader, Anwar Ibrahim, guilty of sodomy and jailed him for five years. While the political situation has not calmed since the verdict, Prime Minister Najib Razak has continued to liberalize the economy. Reforms As of 2015, Malaysia is the 14th most competitive economy in the world, ranked higher than countries like Australia, United Kingdom, South Korea and Japan. Subsidy reforms have not only improved competitiveness but have also bolstered the government’s balance sheet. In December 2014, the government ended all fuel subsidies, saving $5.97 billion annually . The minimum quota for Malay ownership in publicly traded companies has been lowered from 30 percent to 12.5 percent. Changing Economy Economic growth comes with problems as Malaysia’s attractiveness for lower-wage manufacturing has diminished as average wage levels have increased, making Malaysia an upper middle-income country. The government has championed efforts to become the world’s center of Islamic Finance, promoting an appreciation of the currency, even at the cost of exporters. As a result, Malaysia is the global leader in the sukuk (Islamic bond) market, issuing US$17.74 billion worth of sukuk in 2014 – over 66.7% of the global total of US$26.6 billion. Government Budget The Government is hugely reliant on Oil-based revenues from Petronas but has managed to diversify its income sources. While 30% of the government’s total revenue in 2014 still came from oil-based sources, the proportion is lower than 40% in 2009. To further reduce dependence on oil, the government implemented a 6% goods and services tax in April 2015. Due to such measures and a reduction in subsidies, the government debt to GDP ratio has returned to 2010 levels of 52.8%. Currency The Malaysian Dollar (also known as the Ringgit) has been subject to capital controls since September 1998, a consequence of the 1997 Asian financial crisis. The currency was pegged to the dollar at 3.80 from 1998 to 2005. Malaysia ended the peg on July 2005, but the currency is still a managed float, trading within ranges deemed acceptable by the national bank. The currency steady strengthened against the U.S. dollar until the 2013 taper tantrum. (click to enlarge) Despite the weaker currency, the economy has not been stronger since the financial crisis. The economy posted 6.0% GDP growth in 2014 and has averaged 2.3% inflation in the past five years. The benchmark interest rate of 3.25 is unchanged since September 2014, with only one rate hike in the past four years. However, the Current Account to GDP % has decreased from above 15% pre-financial crisis to just 5.7% in the past few years. This decline is unlikely to reverse course as Malaysians utilize their higher incomes to purchase imported goods. Still, the economy is likely to withstand a Fed tightening cycle with over $97 billion in foreign currency reserves . iShares MSCI Malaysia ETF ( EWM) Holdings (click to enlarge) The table above contains the top 16 components of EWM by weight. It should be noted that the numbers presented here, differs from data provided by iShares. While the discrepancy is partially due to the 28.4% weight I did not consider, I believe other factors are at play. For example, the WSJ and iShares disagree on the S&P P/E and dividend yield. The data in the above table was collected from malaysiastock.biz Financial stocks have the highest weight in the ETF at 31% and account for 3 of the top 4 holdings. There is also a divergence in growth between Public Bank ( OTC:PBLOF ) & Malayan Banking ( OTCPK:MLYBY ) vs CIMB ( OTCPK:CIMDF ) & AMMB ( OTC:AMMHF ). The former has enjoyed double digit revenue growth compared the latter at single digits and therefore commands a P/B premium. The utilities are not dividend paying income stocks; rather they are positioned for growth. Both Tenaga Nasional ( OTCPK:TNABY ) and Petronas Gas ( OTC:PNADF ) have dividend yields of 2%, below the 3% yield for the whole ETF. They tend to invest more of their earnings into projects which supply growing electricity demand. Tenaga appears to be the cheapest stock in the ETF but it is merely enjoying the drop in commodity prices last year. The telecoms and financial stocks pay the highest dividends and are the cheapest on a Price/Cash Flow basis. The only consumer staples stock and the only materials stock in the top 16 have negative revenue growth, showing how these sectors are struggling in every market. The stocks with the highest growth rates, the healthcare stock IHH ( OTCPK:IHHHF ) and the consumer discretionary stocks of Genting ( OTC:GEBEY ) also have higher P/E ratios than average. The ETF does not present a bargain in individual stocks or as a whole. The dividend yield is only 1% than yields on developed market stocks. 5yr CAGR growth rates at single digits suggests that there is not much growth to be had by investing in Malaysia. While the P/B and P/Cash Flow ratios seem cheap, it’s only due to the high weighting of financials in the ETF. Conclusion Investing in EWM over the iShares MSCI Emerging Markets ETF (NYSEARCA: EEM ) is not a value, growth or income proposition. While the reforms taken by Prime Minister Najib Razak are encouraging, the political scene remains frothy. An internal power struggle between the PM and his mentor has erupted and respected business leaders are openly criticizing government policies. A possible Fitch downgrade over the $11.5 Billion debt of 1Malaysia Development Berhad (1MDB), a state-owned investment company should also concern current EWM investors. While moves taken to reduce the budget deficit and reliance on oil are encouraging, it would be wiser to revisit the ETF after the Fed raises rates and the political situation improves. Editor’s Note: This article discusses one or more securities that do not trade on a major U.S. exchange. Please be aware of the risks associated with these stocks. Disclosure: I/we have no positions in any stocks mentioned, and no plans to initiate any positions within the next 72 hours. (More…) I wrote this article myself, and it expresses my own opinions. I am not receiving compensation for it (other than from Seeking Alpha). I have no business relationship with any company whose stock is mentioned in this article.

The Bruce Fund: A Great Long-Term Investment

Summary Fund management is very frugal and the expense ratio is only 0.70%. The fund has earned 16% a year over the last 15 years. The fund tends to be relatively uncorrelated with other equity investments. Bruce Fund: Overall Objective and Strategy The primary objective of the Bruce Fund (MUTF: BRUFX ) is to achieve long term capital appreciation by investing primarily in domestic common stocks and bonds, including convertible bonds and “zero coupon” Treasury bonds. Income is a secondary consideration. The fund has built an outstanding long term performance record using a “barbell” type strategy. They often accumulate long-dated zero coupon Treasuries to seek capital appreciation when they feel there is an absence of viable common stock opportunities. But they will also buy higher risk debt securities and own some defaulted bonds selling at a small fraction of their par value. Their strategy is to use primarily bonds which have a very high yield to maturity, or to use convertible bonds which fluctuate with the common stock. Most of these higher risk bonds carry no credit rating. The Bruce Fund invests in domestic common stocks of any market capitalization, although they seem to focus mainly on smaller companies, as well as micro-cap securities. Both growth and value criteria are used to select these stocks. They actively pursue unseasoned companies, out-of-favor, turnaround and distressed situations. The Fund may invest in foreign securities, either directly or through ADRs or GDRs. At times, they hold a large cash position for a transitional period of time and the Fund tends to have a low “beta”. Fund Expenses The expense ratio for BRUFX is 0.70% which is very low for a fund that uses “hedge fund” style strategies. The Bruce Fund management is very frugal. One reason for the low BRUFX expense ratio is that they do not market their fund through discount brokers like Fidelity or Schwab. These brokers generally charge a mutual fund 40 basis points a year for the “privilege” of being on their platforms. Most mutual funds on these platforms offer “special” share classes with higher expense ratios to cover this platform fee. The Bruce Fund refuses to do this, and the fund can only be purchased directly. A mutual fund has to pay a yearly “Blue Sky” fee to every state where they sell the fund. Some small startup mutual funds only register in states where they have enough investors to make it worthwhile. The Bruce Fund started the same way, and until a few years ago, it was not available to Texas or Nebraska residents. But now it is available in every state. Minimum Investment BRUFX has a minimum initial investment of $1,000. Past Performance BRUFX is classified by Morningstar in the “Moderate Allocation” or MA category. BRUFX has blown away the competition and often ranks as the #1 fund in their category. Over the last 15 years, BRUFX has earned 16.37% a year, which trounces the category average of 5.19%. Here are the annual performance figures computed by Morningstar since 2006. 2006 2007 2008 2009 2010 2011 2012 2013 2014 YTD BRUFX 17.72% -5.13% -27.27% 32.26% 23.96% 7.24% 7.86% 18.95% 13.68% 2.56% Category (MA) 11.29% 5.99% -28.00% 24.13% 11.83% -0.11% 11.72% 16.48% 6.21% 2.58% Percentile Rank 4% 99% 41% 8% 1% 2% 76% 1% 1% Source: Morningstar Mutual Fund Ratings -Forbes Honor roll BRUFX is a member of the Forbes Mutual Fund Honor Roll. Forbes Up Market Grade: A+ Forbes Down Market Grade: A -Morningstar Rating : 5 Stars Fund Management The fund is managed by a father and son team, Robert and Jeffrey Bruce. They rarely speak to the press and spend none of their time marketing the fund, although they are glad to speak with shareholders who call. Instead of marketing the fund, they prefer to increase the assets via fund performance. Robert Bruce is 83 years old and previously helped to establish a great performance record at the Mathers Fund (MUTF: MATRX ) over forty years ago. In 1973, he left the Mathers Fund to manage his own money and eventually formed the Bruce fund in 1983 with his son. Bruce Fund Portfolio Analysis (as of December 31, 2014) Common Stock 48.5% Convertible Pfd. 1.8% Corporate Bonds 4.2% Convertible Bonds 5.4% U.S. Treasuries 16.9% Money Market 23.0% Other 0.2% Top 8 Equity Holdings (as of March 31, 2015) Amerco Inc (NASDAQ: UHAL ) 12.01% Allstate Corp (NYSE: ALL ) 3.23% IBM (NYSE: IBM ) 2.92% Airboss of America ( OTC:ABSSF ) 2.63% Pfizer (NYSE: PFE ) 2.21% Merck (NYSE: MRK ) 2.09% NextEra Energy (NYSE: NEE ) 1.89% Flotek Industries (NYSE: FTK ) 1.85% Source: Morningstar Comments It is common on Wall Street to hear fund managers talk about creating shareholder value. But when push comes to shove, the vast majority of mutual fund managers seem more concerned with growing assets under management (and maximizing their own fees) than with maximizing returns for shareholders. That explains the widespread popularity of mutual funds with 12b-1 fees. I give the Bruce Fund a lot of credit for refusing to use 12b-1 fees. They could probably attract a lot more assets if it was available on the discount broker platforms, even with a higher expense ratio. This would benefit the Bruce Fund managers, but would be detrimental to long term shareholders, would have to pay the higher fees every year. I have had a Roth IRA at the Bruce Fund for over ten years. They charge an annual IRA maintenance fee of $15. At first, I found this fee a little annoying, but on second thought I think it is very fair. It costs the fund a little more to administer IRA accounts, but rather than hike the expense ratio for everyone, they just charge this fee to those with IRA accounts. They also allow you to pay this fee with money outside your IRA, so the fee is tax deductible. The Bruce Fund managers are very frugal, but in a good way. The largest equity holding in the Bruce fund is Amerco, which currently trades for $325 a share. There is an interesting story behind this stock. Amerco is the parent company of U-Haul which was experiencing major problems back in 2003 including lawsuits and accounting irregularities. But the Bruce Fund managers liked the underlying business of renting trailers and the company owned a lot of undervalued real estate. Amerco filed for Chapter 11 in June 2003, but their management intended to leave the common equity intact and restructure the debt. Most institutional investors dumped their Amerco shares during this time period when the stock dropped as low as $2 a share. But the Bruce Fund managers stuck with the company and continued to buy more shares through the bankruptcy process. The stock has appreciated about 150 times since then. Another thing I like about the Bruce Fund is its low beta and relative lack of correlation with other equity investments. It has many hedge fund like attributes in the good sense without having to pay 2%/20% management fees. There is also a low turnover ratio, so BRUFX can also be a good investment in taxable accounts. If you want to purchase this fund, you cannot use a broker, and must buy direct. The fund web site is here . Disclosure: I am/we are long BRUFX. (More…) I wrote this article myself, and it expresses my own opinions. I am not receiving compensation for it (other than from Seeking Alpha). I have no business relationship with any company whose stock is mentioned in this article.

Best And Worst: Small Cap Value ETFs, Mutual Funds And Key Holdings

Summary Small Cap Value ranks 11th in 2Q15. Based on an aggregation of ratings of 16 ETFs and 287 mutual funds. VBR is our top rated Small Cap Value ETF and SPSCX is our top rated Small Cap Value mutual fund. The Small Cap Value style ranks 11th out of the 12 fund styles as detailed in our 2Q15 Style Rankings report . It gets our Dangerous rating, which is based on aggregation of ratings of 16 ETFs and 287 mutual funds in the Small Cap Value style. Figures 1 and 2 show the five best and worst rated ETFs and mutual funds in the style. Not all Small Cap Value style ETFs and mutual funds are created the same. The number of holdings varies widely (from 14 to 1511). This variation creates drastically different investment implications and, therefore, ratings. Investors should not buy any Small Cap Value style ETFs or mutual funds because only one gets an Attractive-or-better rating, but it has below $100 million in total net assets. If you must have exposure to this style, you should buy a basket of Attractive-or-better rated stocks and avoid paying undeserved fund fees. Active management has a long history of not paying off. Figure 1: ETFs with the Best & Worst Ratings – Top 5 (click to enlarge) * Best ETFs exclude ETFs with TNAs less than $100 million for inadequate liquidity. Direxion Value Line Small and Mid Cap High Dividend ETF (NYSEARCA: VLSM ) and First Trust Mid Cap Value AlphaDEX ETF (NYSEARCA: FNK ) are excluded from Figure 1 because their total net assets are below $100 million and do not meet our liquidity minimums. Figure 2: Mutual Funds with the Best & Worst Ratings – Top 5 (click to enlarge) * Best mutual funds exclude funds with TNAs less than $100 million for inadequate liquidity. Vanguard Small-Cap Value ETF (NYSEARCA: VBR ) is the top-rated Small Cap Value ETF and Sterling Capital Behavioral Small Cap Value (MUTF: SPSCX ) is the top-rated Small Cap Value mutual fund. Both earn a Neutral rating. One of our favorite stocks held by VBR is Goodyear Tire and Rubber Company (NASDAQ: GT ). In 2014, Goodyear earned an after-tax operating profit ( NOPAT ) of almost $1.4 billion, its highest ever in our model. Despite a 7% revenue decline, the company’s NOPAT was up over 11% year over year. Longer term, NOPAT has risen by 24% compounded annually since 2009. This is a direct result of cost of sales that declined 26% and SGA that declined 4% from 2011, bringing total expenses down by 21%. All of this expense trimming has raised Goodyear’s after-tax margins to almost 8%, up from 4% in 2012 and its return on invested capital ( ROIC ) from under 6% in 2012 to 9% today. Goodyear Tire was our Stock Pick of the Week several weeks ago. Despite the positive growth of the business, the stock is undervalued. If Goodyear can grow NOPAT by just 1% compounded annually for the next 10 years , the company is worth $37/share – a 19% upside from current levels. It will be difficult for Goodyear to fail to beat expectations as low as these when considering the company’s historical profit growth rate since 2000 is 18% compounded annually. PowerShares Fundamental Pure Small Value Portfolio (NYSEARCA: PXSV ) is the worst rated Small Cap Value ETF and Aston River Road Independent Value Fund (MUTF: ARIVX ) is the worst rated Small Cap Value mutual fund. PXSV earns a Dangerous rating and ARIVX earns a Very Dangerous rating. One of the worst rated stocks held by Small Cap Value funds is Almost Family Inc. (NASDAQ: AFAM ). Almost Family provides home health services throughout the United States. Since 2010, Almost Family’s NOPAT has declined from $32 million to $15 million in 2014, a decline of 17% compounded annually. ROIC has also seen a similar decline, down from 19% to 5% over the same timeframe. Almost Family has also generated negative economic earnings for the past two years. Considering the lack of growth shown above, AFAM is currently overvalued. To justify its current price of $39/share, the company would need to grow NOPAT by 15% compounded annually for the next 11 years . This seems very optimistic given that AFAM’s NOPAT has declined since 2010. Figures 3 and 4 show the rating landscape of all Small Cap Value ETFs and mutual funds. Figure 3: Separating the Best ETFs From the Worst ETFs (click to enlarge) Figure 4: Separating the Best Mutual Funds From the Worst Funds (click to enlarge) Sources Figures 1-4: New Constructs, LLC and company filings Disclosure: David Trainer and Allen L. Jackson receive no compensation to write about any specific stock, style, style or theme. Disclosure: I/we have no positions in any stocks mentioned, and no plans to initiate any positions within the next 72 hours. (More…) I wrote this article myself, and it expresses my own opinions. I am not receiving compensation for it. I have no business relationship with any company whose stock is mentioned in this article.